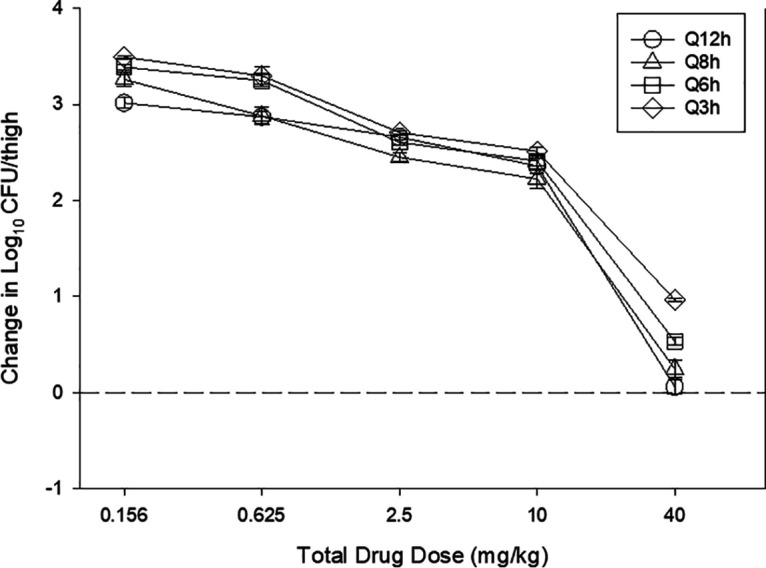
FIG 2.

In vivo dose fractionation with MRX-8 using a neutropenic mouse thigh model. Each symbol represents the mean and standard deviation from four thighs infected with E. coli ATCC 25922. The error bars represent the standard deviations. The burden of organisms was measured at the start and end of therapy. The study period was 24 h. Five total drug (milligrams per kilogram per 24 h) dose levels were fractionated into one of four dosing regimens and are shown on the x axis. The y axis represents the change in the organism burden from the start of therapy. The dashed horizontal line represents net stasis over the treatment period.
