
Figure 2: Spatial control of neuronal activity by microglia.
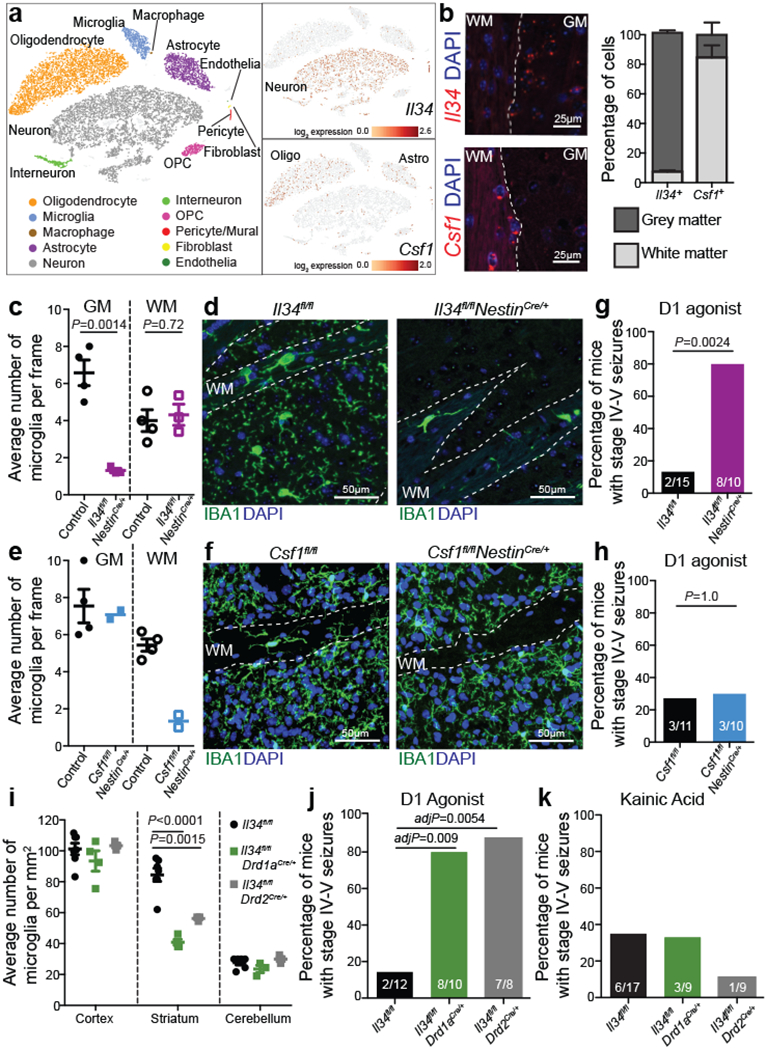
a, Left, cell populations in the mouse striatum (t-distributed stochastic neighbour embedding (t-SNE) plot) identified by single-nuclei RNA expression analysis (15,950 nuclei). Right, Il34 (top) or Csf1 (bottom) RNA-expressing cells. b, Il34+ (top left; red) and Csf1+ cells (bottom left; red) identified by RNA in situ hybridization, DAPI+ nuclei (blue), grey matter (GM), and white matter (WM). Right, distribution of Il34+ and Csf1+ cells in GM (Il34+, 93%; Csf1+, 15%) and WM (Il34+, 7%; Csf1+, 85%) in the striatum (n = 2 and 4 mice per group, respectively). c-h, Il34fl/fl and Csf1fl/fl mice were bred to NestinCre/+ mice to generate Il34fl/fl;NestinCre/+ (purple) and Csf1fl/fl;NestinCre/+ (blue) mice. c, e, Striatal microglia numbers in GM and WM in control and mutant mice shown per frame (c: n=4 and 3 mice; unpaired two-tailed t-test e: n=4 and 2 mice) d, f, Representative images of control and mutant striatum sections showing IBA1+ (green) nucleated (DAPI+, blue) microglia. g, h, Percentages of mice with seizures in response to D1 agonist (SKF81297, 5 mg/kg) (g: n=15 and 10 mice, P=0.0024, Fisher’s exact test; h: n=11 and 10 mice; P=1.0, Fisher’s exact test). i-k, Il34fl/fl mice were bred to Drd1aCre/+ or Drd2Cre/+ mice to generate Il34fl/fl;Drd1aCre/+ (green) and Il34fl/fl;Drd2Cre/+ (grey) mice. i, Number of microglia/mm2 in cortex, striatum, and cerebellum (n=7, 4, and 3 mice, cortex: P=0.38; striatum: P<0.0001; cerebellum: P=0.14, One-way ANOVA with Tukey’s post hoc test). j-k, Percentage of mice with seizures within 1hr in response to D1 agonist (j, SKF81297, 5mg/kg) or kainic acid (k, 18mg/kg). (j: n=12, 10, and 8 mice; P=0.0014; k: n=17, 9, and 9 mice; P=0.40, Chi-squared test with Bonferroni adjustment). The experiments in g have been independently repeated in a second cohort with identical results. Data shown as mean± s.e.m.