
Extended Data Figure 2. Microglia deficient mice show normal baseline behaviors but exaggerated responses to neurostimulants.
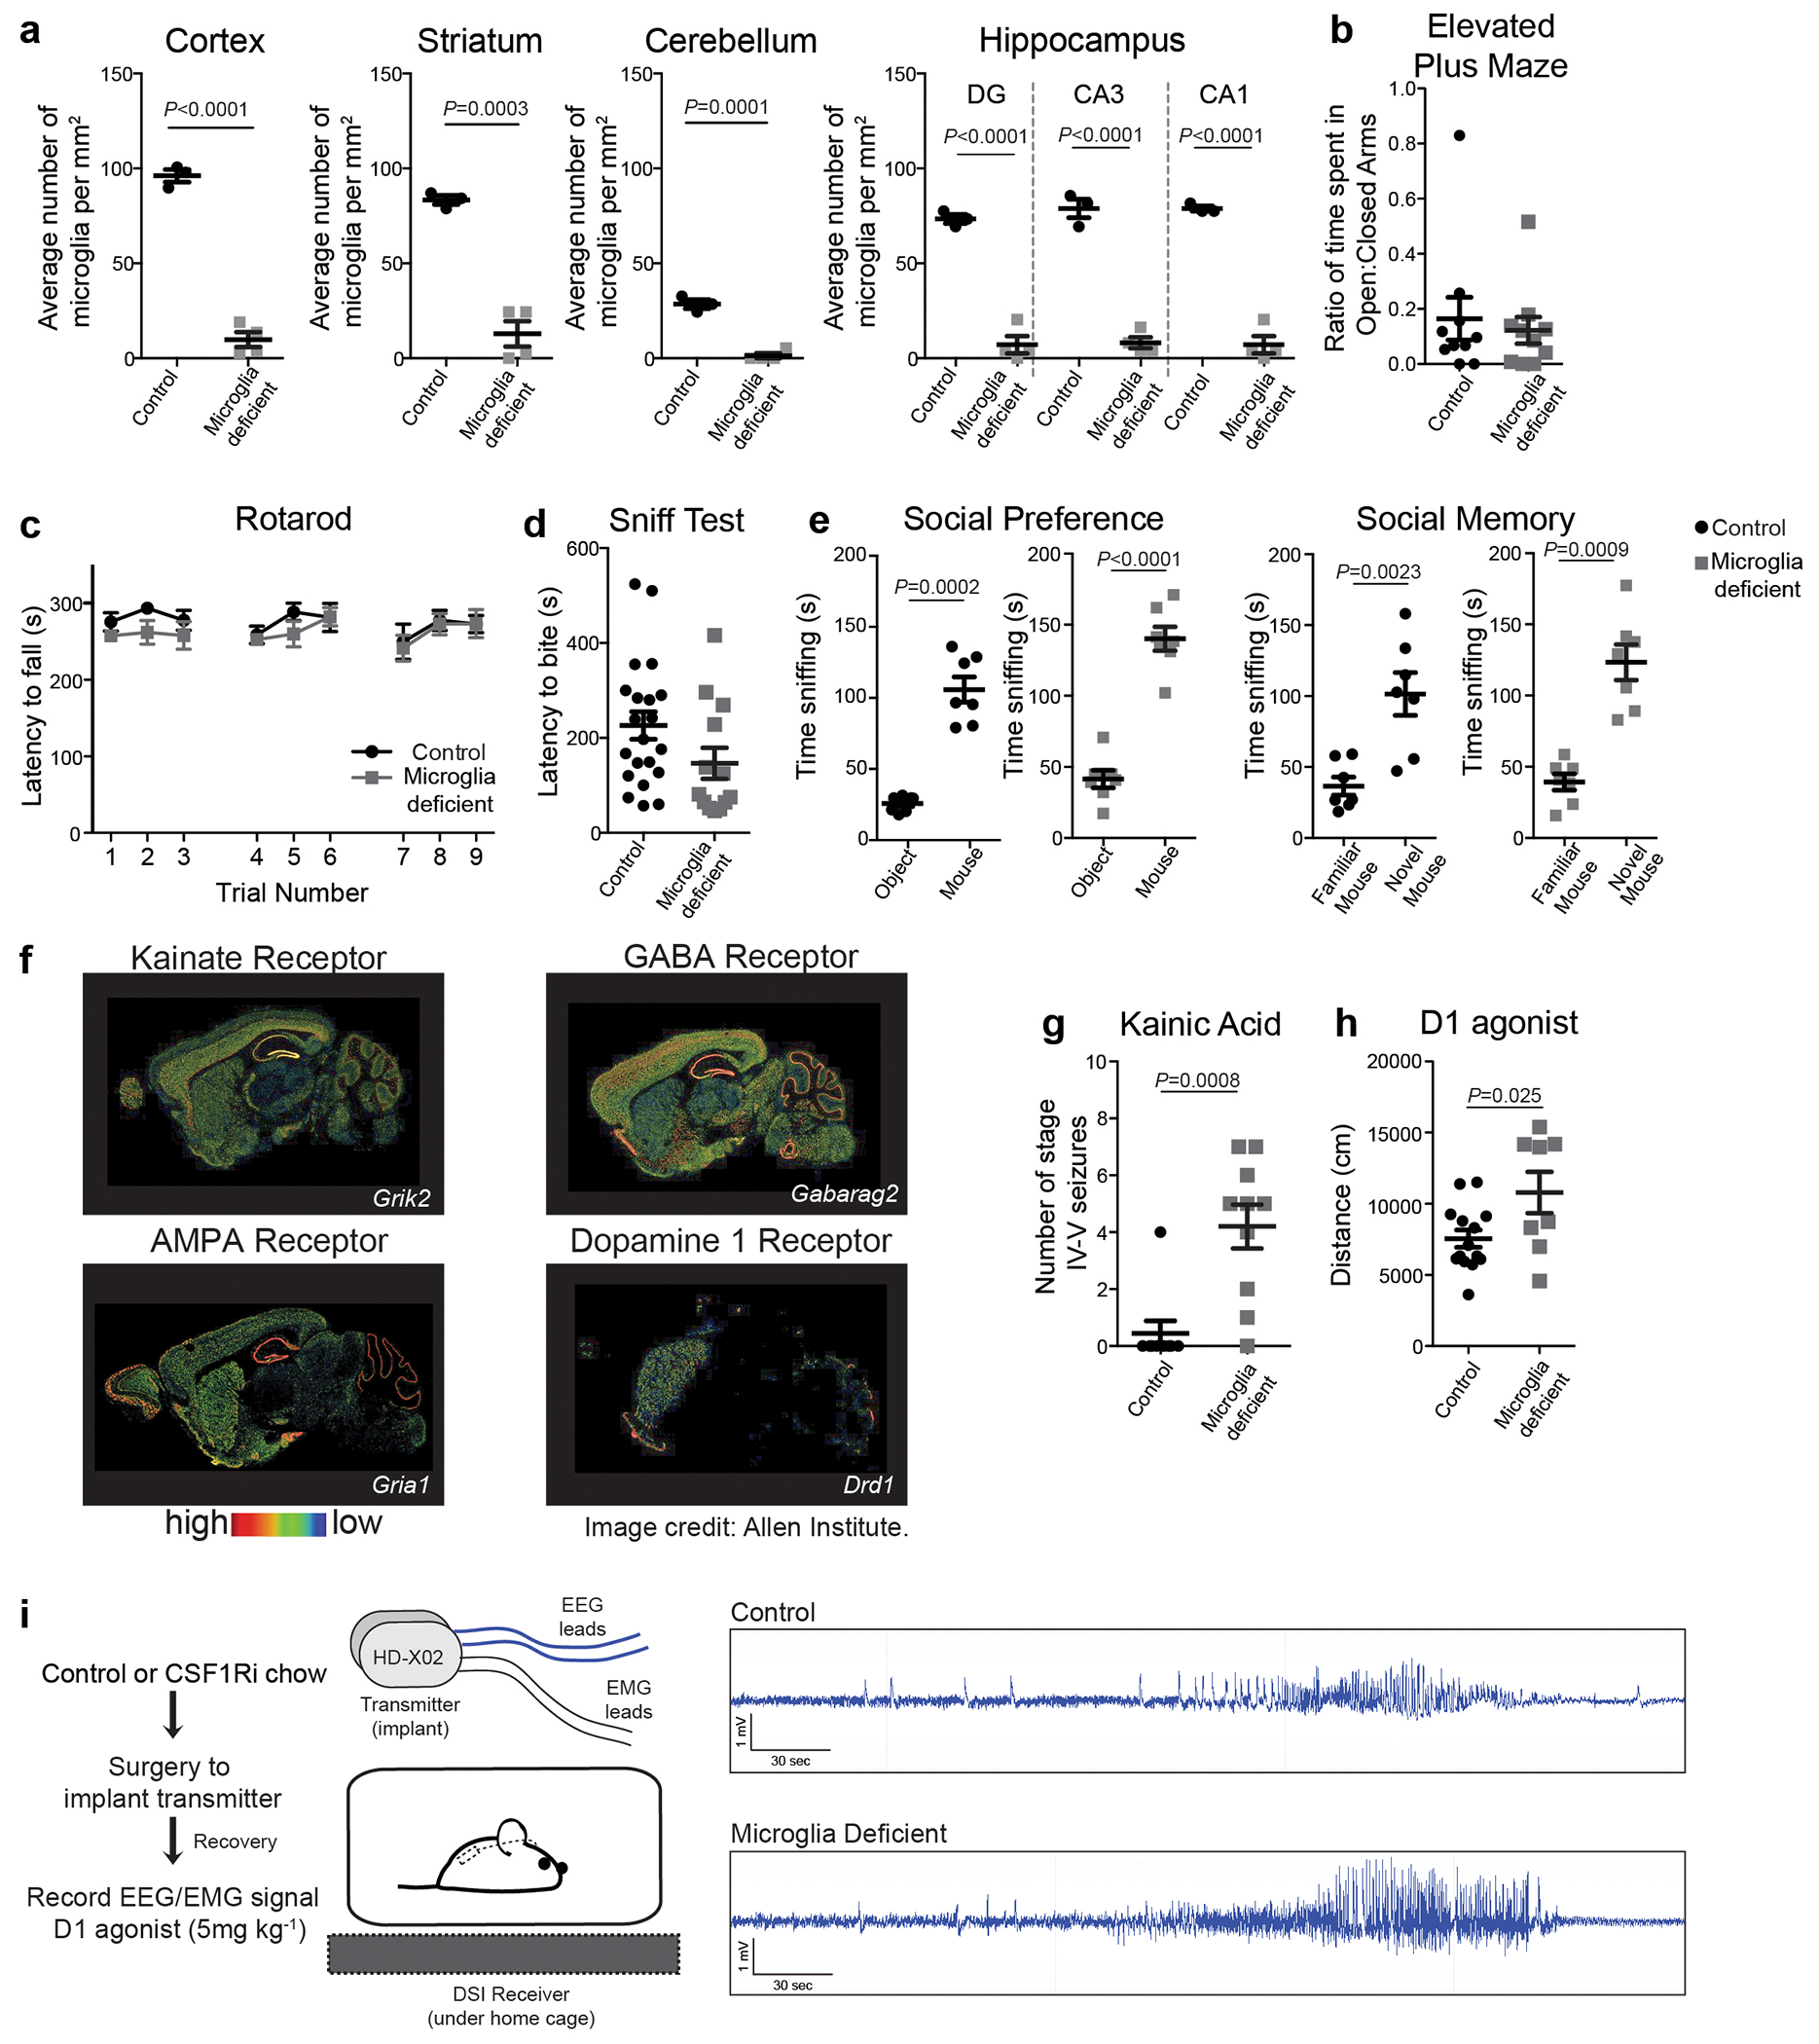
a, Dot plots show the average number of microglia per mm2 in cortex, striatum, cerebellum and hippocampus in control and microglia deficient mice (n=3 and 4 mice, cortex: P<0.0001, striatum: P=0.0003, cerebellum: P=0.0001, DG: P<0.0001, CA3: P<0.0001, CA1: P<0.0001, unpaired two-tailed t-test). b-e, Behavioral characteristics of microglia deficient mice. b, Anxiety-like behavior was measured by the ratio of time spent in the open arms/closed arms in the elevated plus maze (n=10 mice, P=0.65, unpaired two-tailed t-test). c, Motor coordination was measured by latency to fall from the accelerating rotarod (n=8 and12 mice, interaction: P=0.89, time: P=0.13, treatment: P=0.36; subjects: P<0.0001, Two-way repeated measures ANOVA). d, Olfactory behavior was measured by the sniff test (n=21 and 13 mice, P=0.09, unpaired two-tailed t-test). e, Social behavior was measured by using the classic three-chamber sociability task (Social preference: mouse preference for sniffing another mouse over object, Control: n=7 mice; P=0.0002, microglia deficient: n=9 mice, P<0.0001; Social Memory: mouse preference for sniffing novel mouse over familiar mouse, Control n=7 mice, P=0.0023, microglia deficient: n=7 mice, P=0.0009; paired two-tailed t-test). f, Representative images show brain-wide gene expression patterns of receptors targeted by kainic acid (kainate and AMPA receptor), picrotoxin (GABAA receptor), and SKF81297 (D1 receptor) (Allen Institute). g, Number of stage IV-V seizures (Racine scale90) per mouse visually recorded within one hour in response to kainic acid (18mg/kg, i.p.) are shown as a dot plot (n=9 and 10 mice, P=0.0008, unpaired two-tailed t-test). h, Dot plot showing distance traveled in response to D1 agonist in one hour in the open field (SKF81297, 3mg/kg, i.p.)(n=14 and 8 mice, P=0.025, unpaired two-tailed t-test). i, Representative cortical EEG traces during a tonic-clonic seizure event in response to D1 agonist treatment (SKF81297, 5mg/kg i.p.) in control (top) and microglia deficient (bottom) mice showing high amplitude and rhythmic discharges followed by EEG depression. DG: dentate gyrus; Data shown as mean± s.e.m.