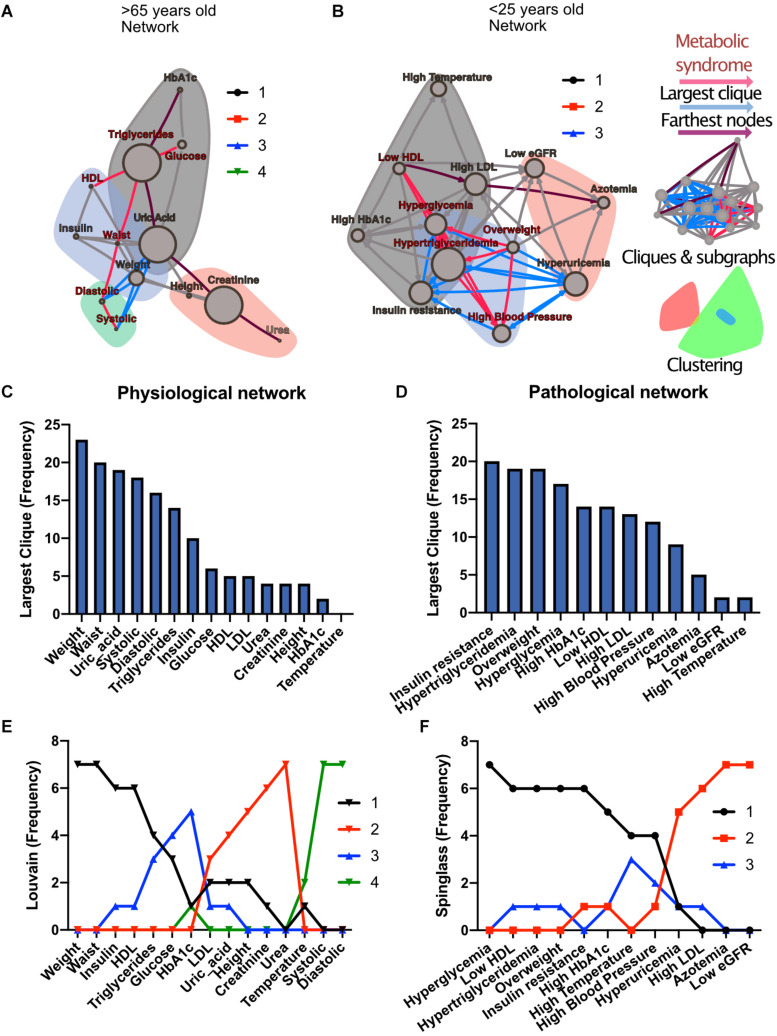
FIGURE 1.
Physiological subsystems identified by Data-driven association. Representative networks (A) for the physiological variables network and (B) for the pathological states network. Physiological variables and pathological states clusters are shown as largest cliques (blue connections), and, as clusters (nodes within color highlighted areas). In both metabolic physiological networks, the red subgraph shows the currently accepted MetS components. The diameter of the network – the two furthest nodes path – is highlighted in purple. (C) Frequency of physiological variables composing the largest clique of each age group network. (D) Frequency of pathological states fully associated within largest cliques as shown by the pathological states network. The frequency of appearance of a node pertaining to a certain cluster (membership) was registered. Since 7 networks were generated (all participants, and 6 age-range groups), a node belonging to the same cluster across the entire lifespan would reach a value of 7. In panel (E), the frequency value represents how many times a node is part of the same cluster for the physiological variables, where the Louvain algorithm was used to determine clusters. Three main clusters appear, with blood pressure variables making a fourth. (F) Cluster membership of pathological states using the spinglass community algorithm that selects the group of nodes most likely to be found in the same state. Three main clusters appear, with different groups of pathological states in each one.

