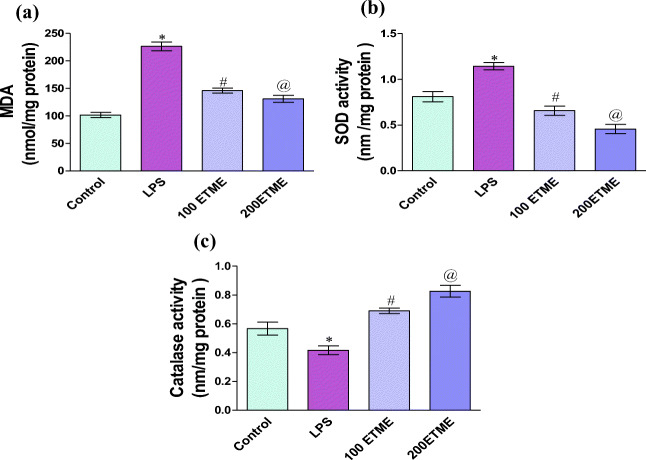
Fig. 3.
a Effect of different doses of ETME on the level of MDA in LPS induced oxidative stress.*p < 0.05 compared to the control group, # p < 0.05 significant changes occurs between 100 ETME to the LPS group, @ represent significant p < 0.05 change occurs between 200 ETME compared to the LPS group. b Effect of different doses of ETME on the SOD enzyme in LPS induced oxidative stress.*p < 0.05 compared to the control group, # p < 0.05 significant changes occurs between 100 ETME to the LPS group, @ represent significant p < 0.05 change occurs between 200 ETME compared to the LPS group. c Effect of different doses of ETME on the catalase enzyme in LPS induced oxidative stress.*p < 0.05 significant changes occurs between 100 ETME to the LPS group, @ represent significant p < 0.05 change occurs between 200 ETME compared to the LPS group

