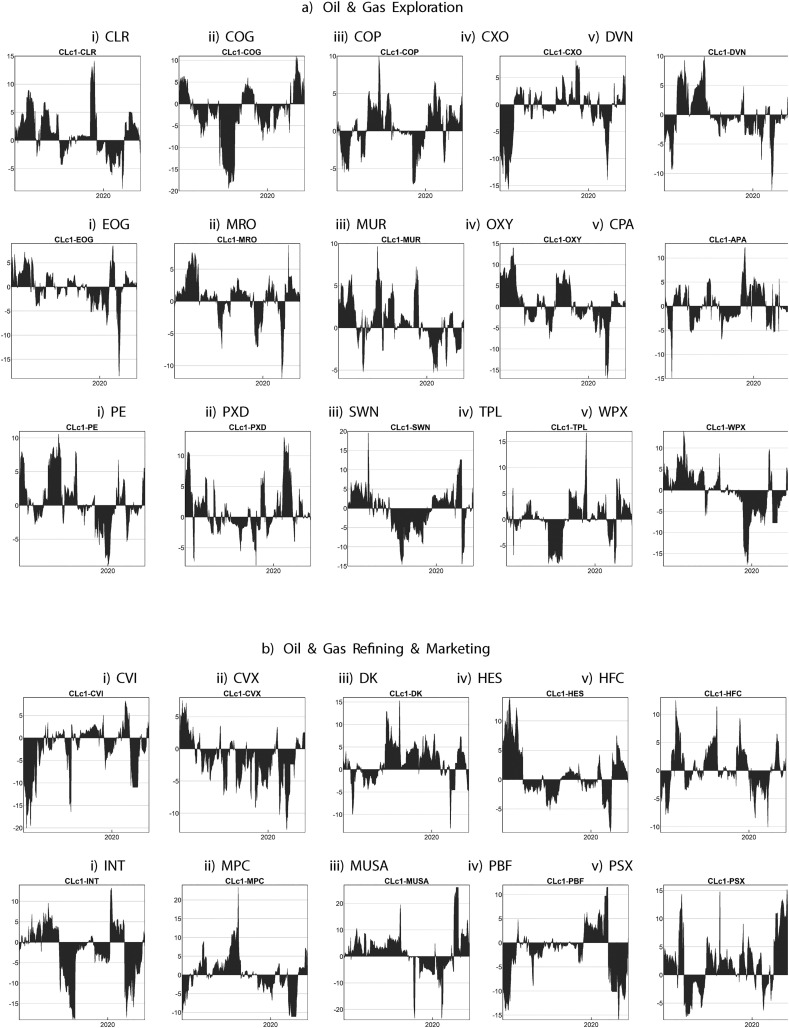
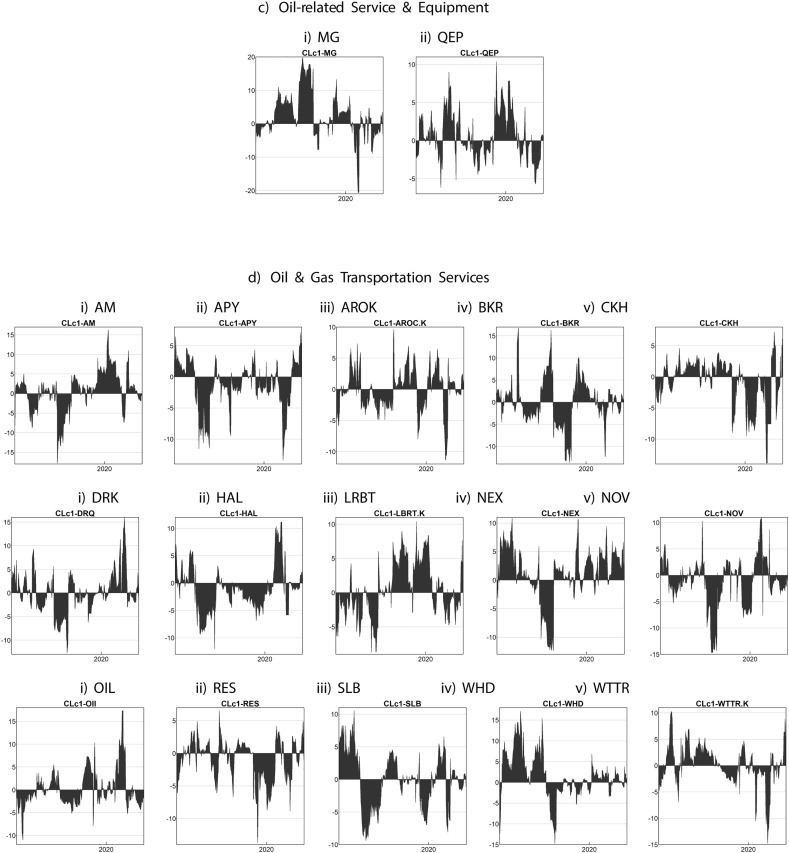
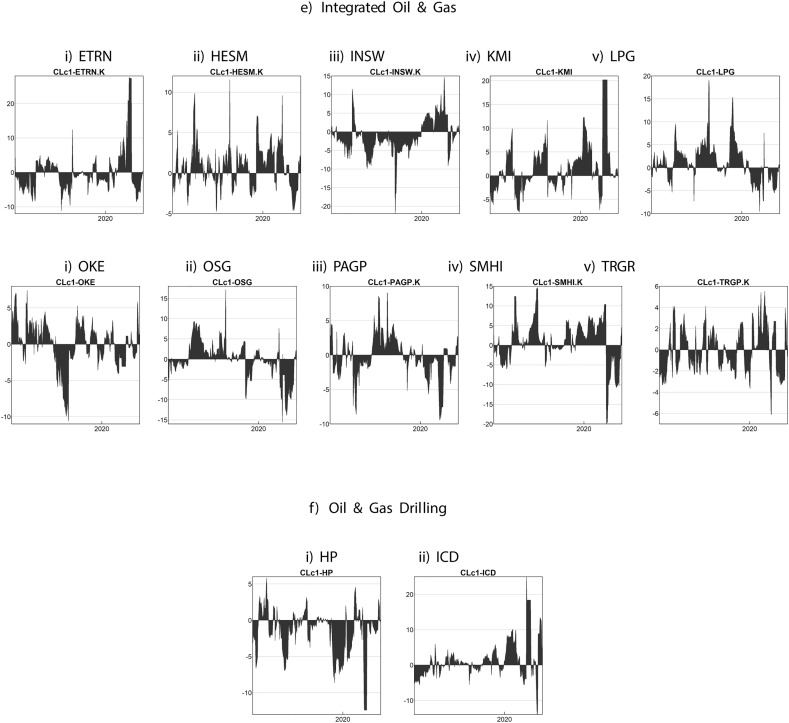
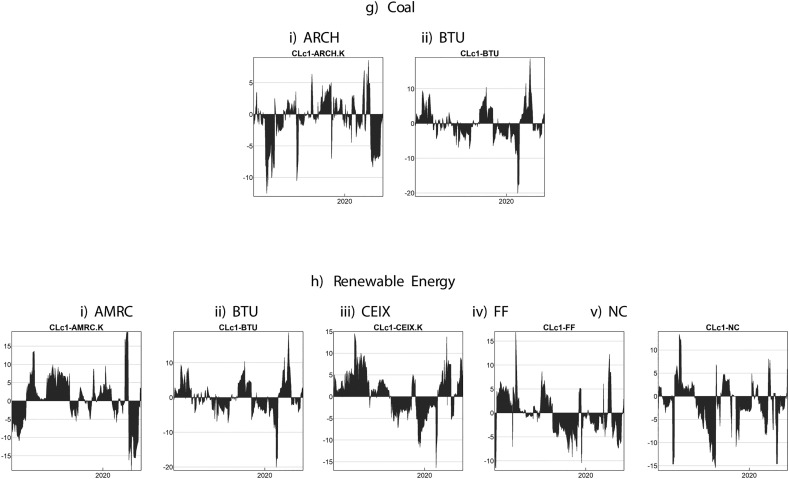
Fig. 8.
Net pairwise directional volatility spillovers, absolute returns, 50-day window.
Note: The above table represents the net pairwise directional volatility spillovers by stated energy sector. To examine spillovers in the volatility of WTI during the outbreak of the COVID-19 pandemic and the subsequent effects of negative oil prices, and the effects of each event on energy-companies in the US, we apply the generalised version of the spillover index proposed by Diebold and Yilmaz (2009), and which builds on the vector autoregressive (VAR) models developed by Sims (1980).


