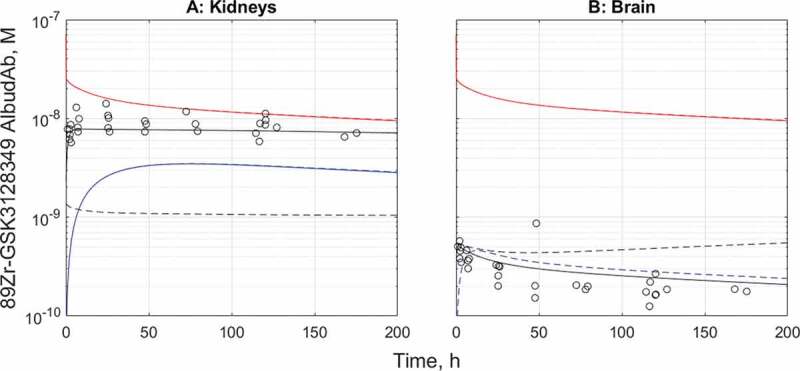
Figure 3.

The tissue distribution time course results before and after fitting for kidneys (a) and the brain (b). Red: total 89Zr-containing species in plasma, black-tissue average of total 89Zr, blue-predicted interstitial concentration. Solid line-fitted model, dashed line-default model. Solid and dashed lines overlay for the capillary plasma compartment in both organs and for the interstitial compartment in kidneys
