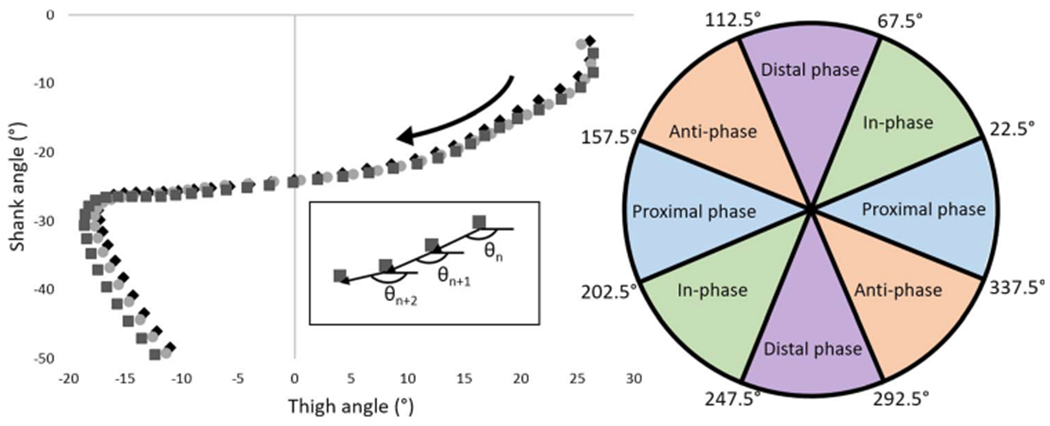
FIGURE 1—

Exemplar vector coding methods. Left-hand graph shows a sagittal thigh vs shank angle-angle plot during stance over multiple strides. Curved arrow indicates direction of gait cycle progression. Inset demonstrates phase angle (θ) calculation between gait cycle points. Right hand graph shows angle ranges for phase angle patterns. The phase angles exemplified in the inset would fall into the 157.5° to 202.5° proximal phase pattern.
