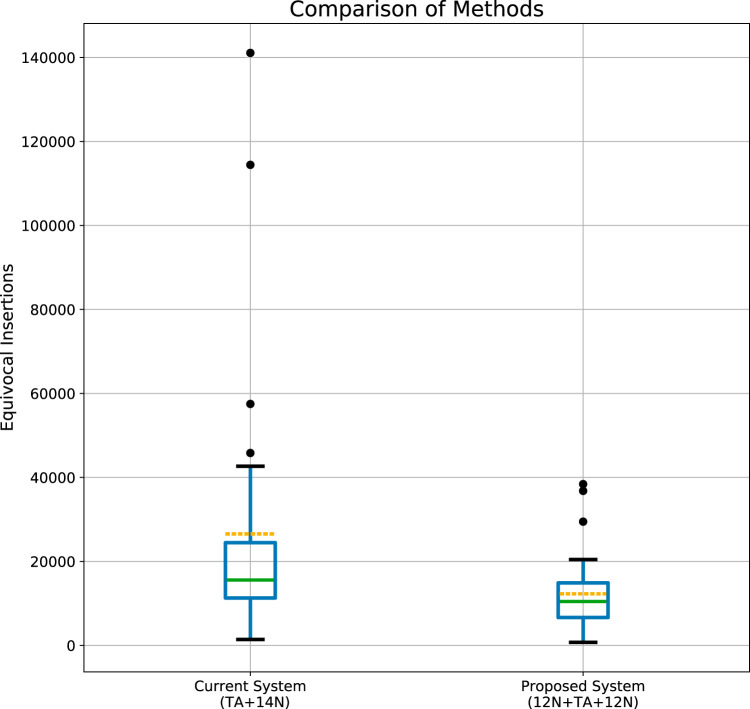
FIG 2.
Distribution of equivocally identified insertion sites in the two methods. The number of the equivocally identified insertion sites was calculated for 30 organisms for both methods. The interquartile range (IQR) in the box plot shows the median (green line) and the mean (yellow dashed line). “Whiskers” above the upper quartile and below the lower quartile show the range of the maximum and minimum values. The distribution of the equivocally identified insertion sites is significantly different between the methods; Mann-Whitney U test, P = 0.002.

