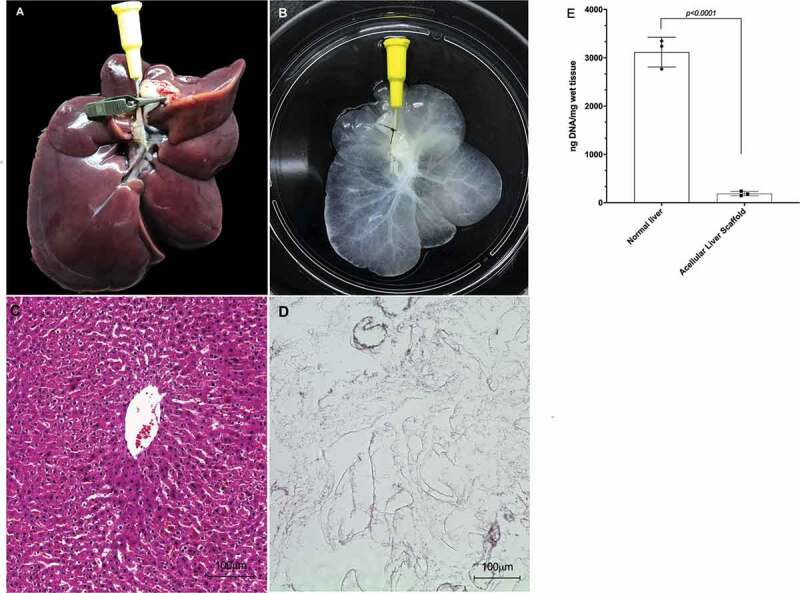
Figure 5.

Macroscopic and Microscopic appearance of normal liver and acellular liver scaffold obtained by decellularization process. Normal (a) and acellular liver scaffold (b). Hematoxylin and eosin staining of the normal liver (c) and acellular liver scaffold (d). 10x and 20x magnification, respectively. Scale bars: 100 µm. DNA quantification demonstrated significant DNA reduction from 3118,4 ng/mg in normal liver to 189,06 ng/mg in acellular liver scaffold (e). N = 3 biological triplicates, *p < .05.
