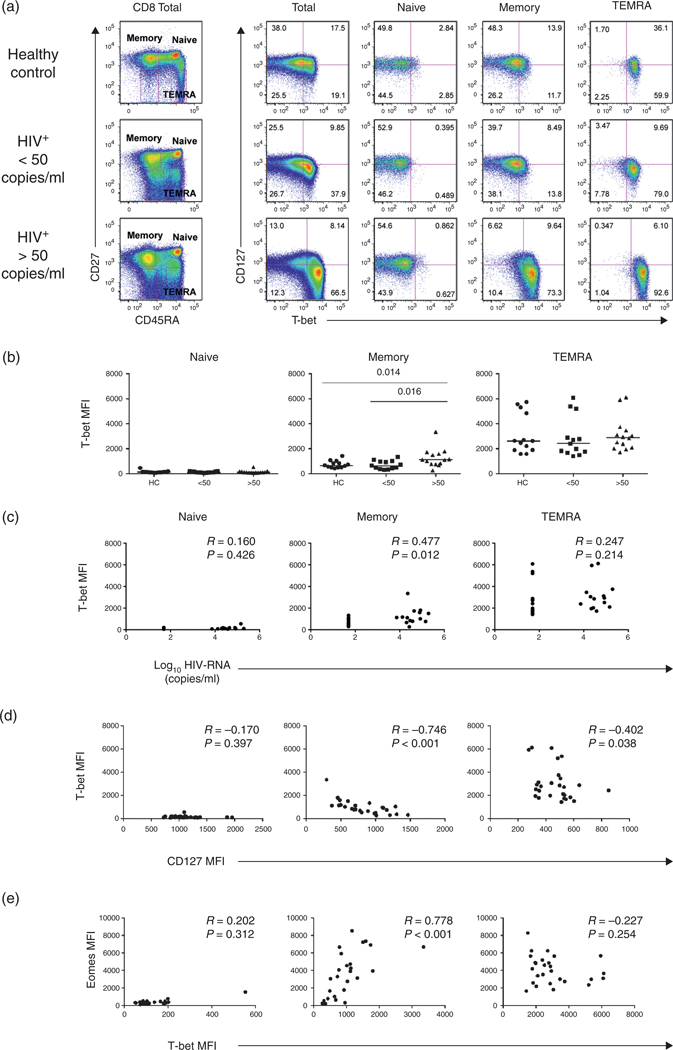
Fig. 3. Protein expression of T-bet and CD127 in CD8 T-cell subsets from healthy controls and HIV-infected patients.
(a) Representative dot plots from the three cohorts studied (Fig. 2 for T-bet and CD127 expression). (b) T-bet median fluorescence intensity in CD8 T-cell subsets (as above). (c) Correlations between T-bet expression and HIV-RNA levels; and (d) Correlations between CD127 and T-bet expression. (e) Correlations between Eomes and T-bet expression in CD8 T-cell subsets.

