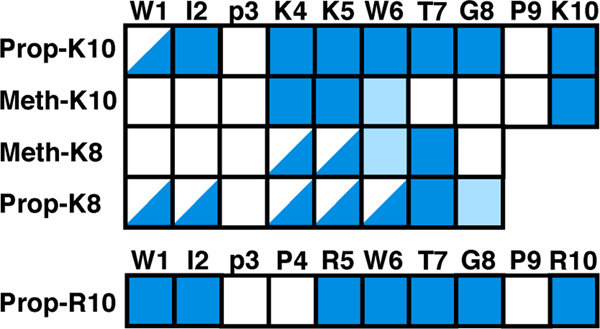
Figure 4.
Amide cross peak patterns observed in the 1H-15N HSQC spectra for each of the NiII-peptide complexes. Each square represents an amide cross peak from the 1H-15N HSQC: solid blue = present, light blue = present but weak, half blue = dual resonances and white = not present (no cross peak is expected for proline). Cross peaks for the first two residues have the most sensitivity to the linker identity, while residues 4–6 are the most sensitive to peptide length.

