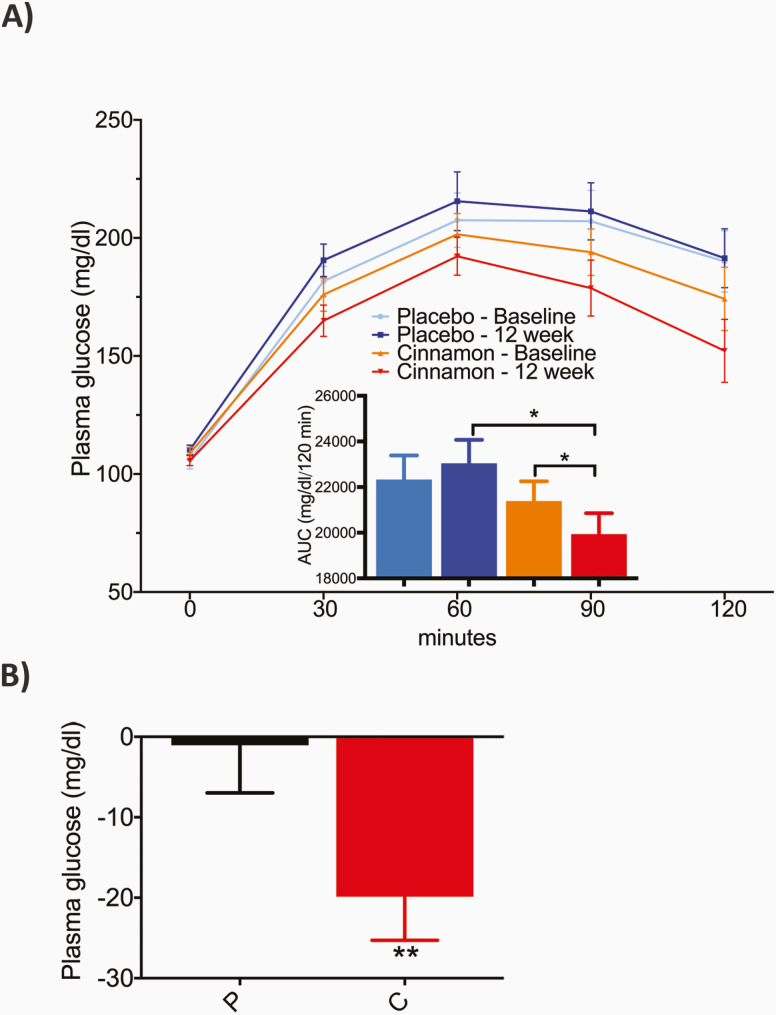
Figure 2.
Change in A, overall plasma glucose (PG) profile, and B, 2-hour plasma glucose of the oral glucose tolerance test (OGTT), from baseline to 12 weeks. A, PG profile and corresponding area under the curve (AUC, inset) of the OGTT, at baseline and after 12 weeks, on placebo and cinnamon. B, Mean PG change at 2-hour time point from respective baseline OGTT (0) to OGTT at 12 weeks with placebo (P) and cinnamon (C). Data are presented as mean ± SEM. Between-group differences were analyzed by analysis of covariance. Within-group differences were analyzed by paired t test. *P less than .05; **P less than .01; ***P less than .001.

