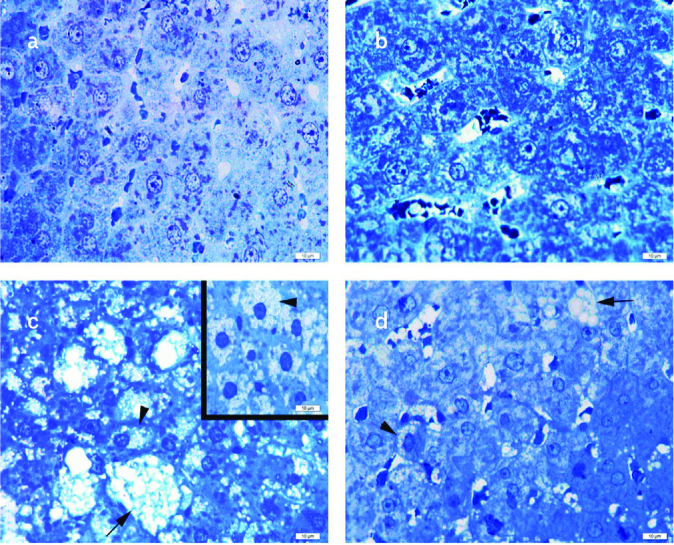
Figure 5. a–d.

Normal liver parenchyma with hepatocytes and sinusoids in the standard (STD) (a) and STD+exercise (EXC) (b) groups; ballooned hepatocytes (arrow) and microvesicular steatosis (arrowhead) in the high-fat diet (HFD) group (c); decreased ballooned hepatocytes (arrow) and microvesicular steatosis (arrowhead) in the HFD+EXC group (d) seen on toluidine blue staining.
