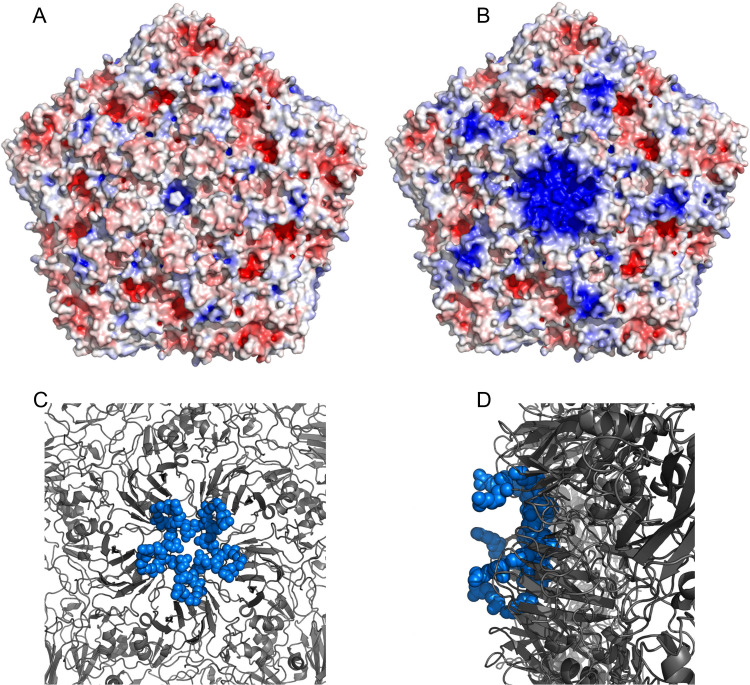
Fig 3. Charge distribution and clustering of mutations on the capsid surface.
(A) Electrostatic potential of wild-type SAT1 capsid showing uniform charge distribution on the particle surface. (B) Electrostatic potential of the mutant SAT1 capsid showing clustering of positive charge at the 5-fold axis. The electrostatic potential was calculated using the APBS plugin embedded within Pymol. The colouring represents positive charge (blue), negative charge (red) and neutral (white). (C) The projection of the capsid on a 5-fold axis shows the clustering of the positively charged mutations from the top view. (D) The projection showing the side view and the surface exposure of the mutant side chains.

