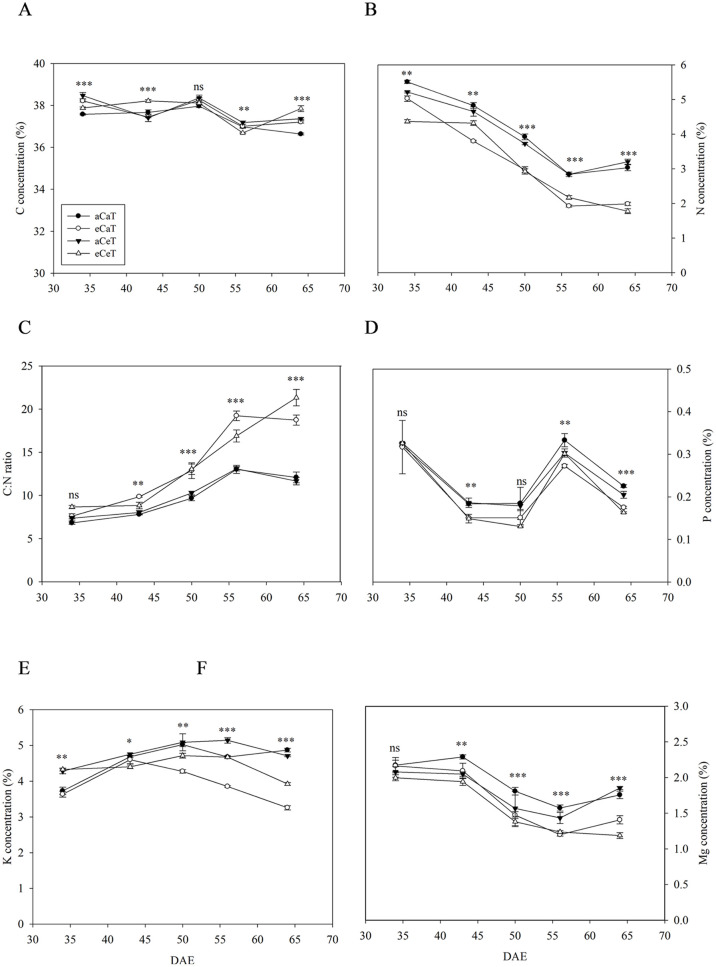
Fig 8. Carbon (A), nitrogen (B), C: N ratio (C), phosphorus (D), potassium (E), and magnesium (F) in potato leaves at 35, 43, 50, 58, and 64 DAE under different CO2 and temperature conditions.
Values are mean ± SE (n = 3). Bars indicate significant differences among treatments at P < 0.05 according to Tukey’s test. DAE: Days after emergence.

