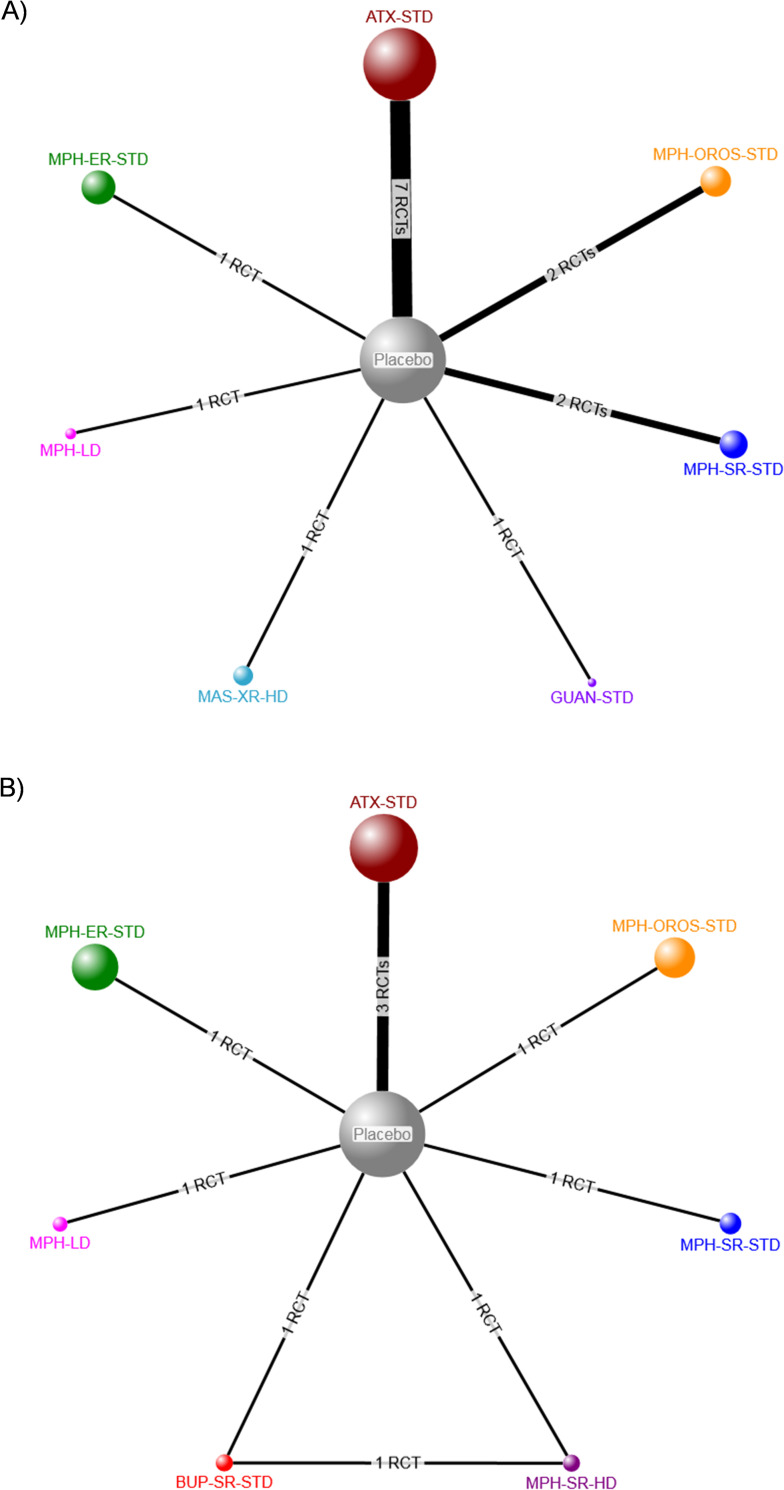
Fig 6. Network diagrams for patient-reported clinical response.
Treatment nodes are proportional to the number of patients who took the corresponding treatment, while the width of each edge is proportional to the number of trials included in the comparison. Intervention abbreviations: ATX = atomoxetine, GUAN = guanfacine, HD = high dose, MAS-XR = mixed amphetamine salts, MPH = methylphenidate, OROS = osmotic-release oral system, ER = extended release, SR = sustained release, STD = standard dose. (A) Continuous measure of response. (B) Dichotomous (treatment response: yes versus no).

