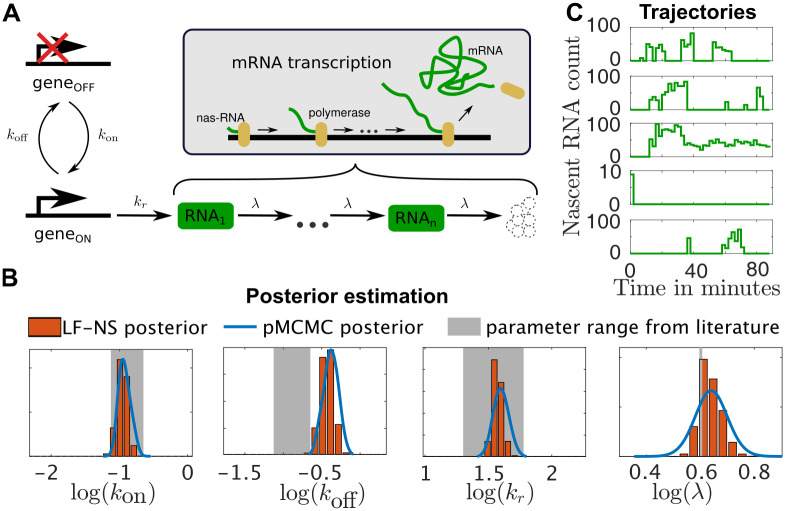
Fig 5. Inference on the transcription model.
A: Schematic representation of the gene expression model. The model consists of a gene that switches between an “on” and an “off” state with rates kon and koff. When “on” the gene is getting transcribed at rate kr. The transcription process is modelled through n RNA species that sequentially transform from one to the next at rate λ. The observed species are all of the intermediate RNAi species. B: The marginal posterior distribution of the parameters of the system. The histogram indicates the posterior obtained through LF-NS, the blue line indicates the posterior obtained from a long pMCMC run and the shaded areas indicate the parameter ranges that were considered in [58]. The scale of the x-axis does not represent the range of the prior and has been chosen for presentational purposes. C: The five trajectories used for the parameter inference.

