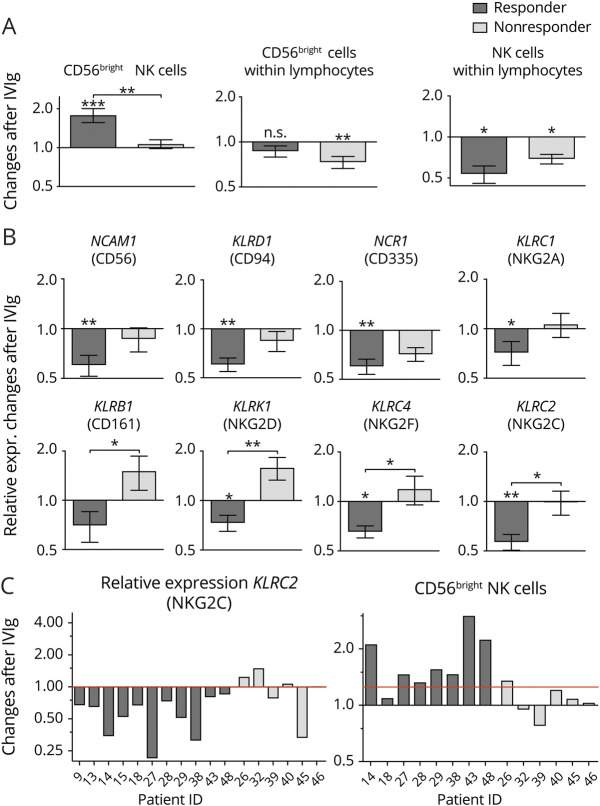
Figure 5. Reduction of NK cell marker expression after 24-hour IVIg treatment is more pronounced in responding patients.
(A) Changes of frequencies of relevant NK cell markers in PBMCs of patients with CIDP 24 hours after IVIg infusion related to baseline in responders (n = 11) and nonresponders (n = 6). Frequency of CD56bright NK cells was determined within the total NK cell population and within lymphocytes. Asterisks above bars indicate significant changes after IVIg treatment compared with control (*p < 0.05, **p < 0.01, ***p < 0.001; nonparametric distribution, Wilcoxon rank test for paired samples). Asterisks between bars indicate significant changes between the responder and nonresponder cohort. Depicted is mean ± SEM (*p < 0.05, **p < 0.01; nonparametric distribution, unpaired; Mann-Whitney U test). (B) Changes of the transcription level of relevant NK cell genes in PBMCs of patients with CIDP 24 hours after IVIg infusion related to baseline in responders (n = 11) and nonresponders (n = 6). Asterisks above bars indicate significant changes after IVIg treatment compared with control (*p < 0.05, **p < 0.01; nonparametric distribution, Wilcoxon rank test for paired samples). Asterisks between bars indicate significant changes between the responder and nonresponder cohort. Depicted is mean ± SEM (*p < 0.05, **p < 0.01; nonparametric distribution, unpaired; Mann-Whitney U test). (C) Changes in PBMCs of patients with CIDP after 24 hours of IVIg infusion in representative markers of NK cells on gene expression and surface expression in the individual patients related to baseline (responders n = 8, nonresponders n = 6). CIDP = chronic inflammatory demyelinating neuropathy; IVIg = IV immunoglobulin; NK = natural killer; PBMC = peripheral blood mononuclear cell.

