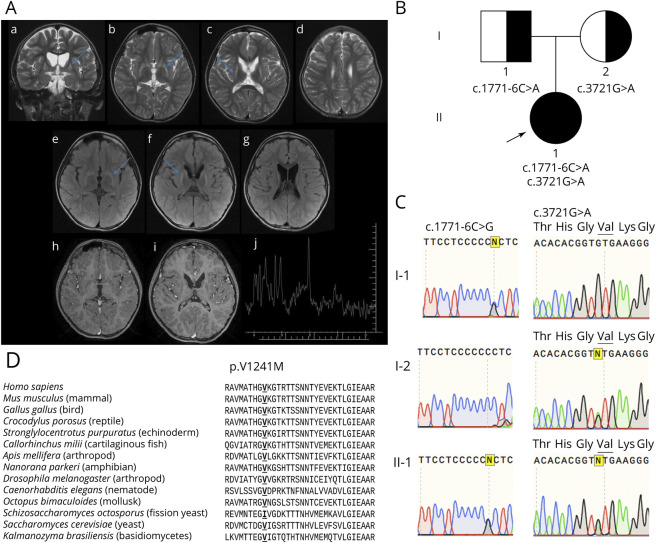
Figure 1. Brain MRI and chromatograms of DNA sequence and alignment of POLR3A in several species.
(A) Brain MRI of the proband showing hyperintense signal in T2 (blue arrows), volumetric reduction of the putamen and caudate nucleus (a and f). Spectroscopy (j) shows peak of lactate and lipids. (B) Segregation of POLR3A mutations c.1771-6C>A from the father and c.3721G>A from the mother to the proband (indicated by an arrow). (C) Chromatograms showing mutations c.1771-6C>A in heterozygosity in the father (I-1) and c.3721G>A (p.V1241M) in heterozygosity in the mother (I-2) and the presence of both in the proband (II-1). (D) Alignment of 1,241 residue of the POLR3A, species were selected from sequences obtained from a 4-iteration PSI-BlastP with default parameter research.

