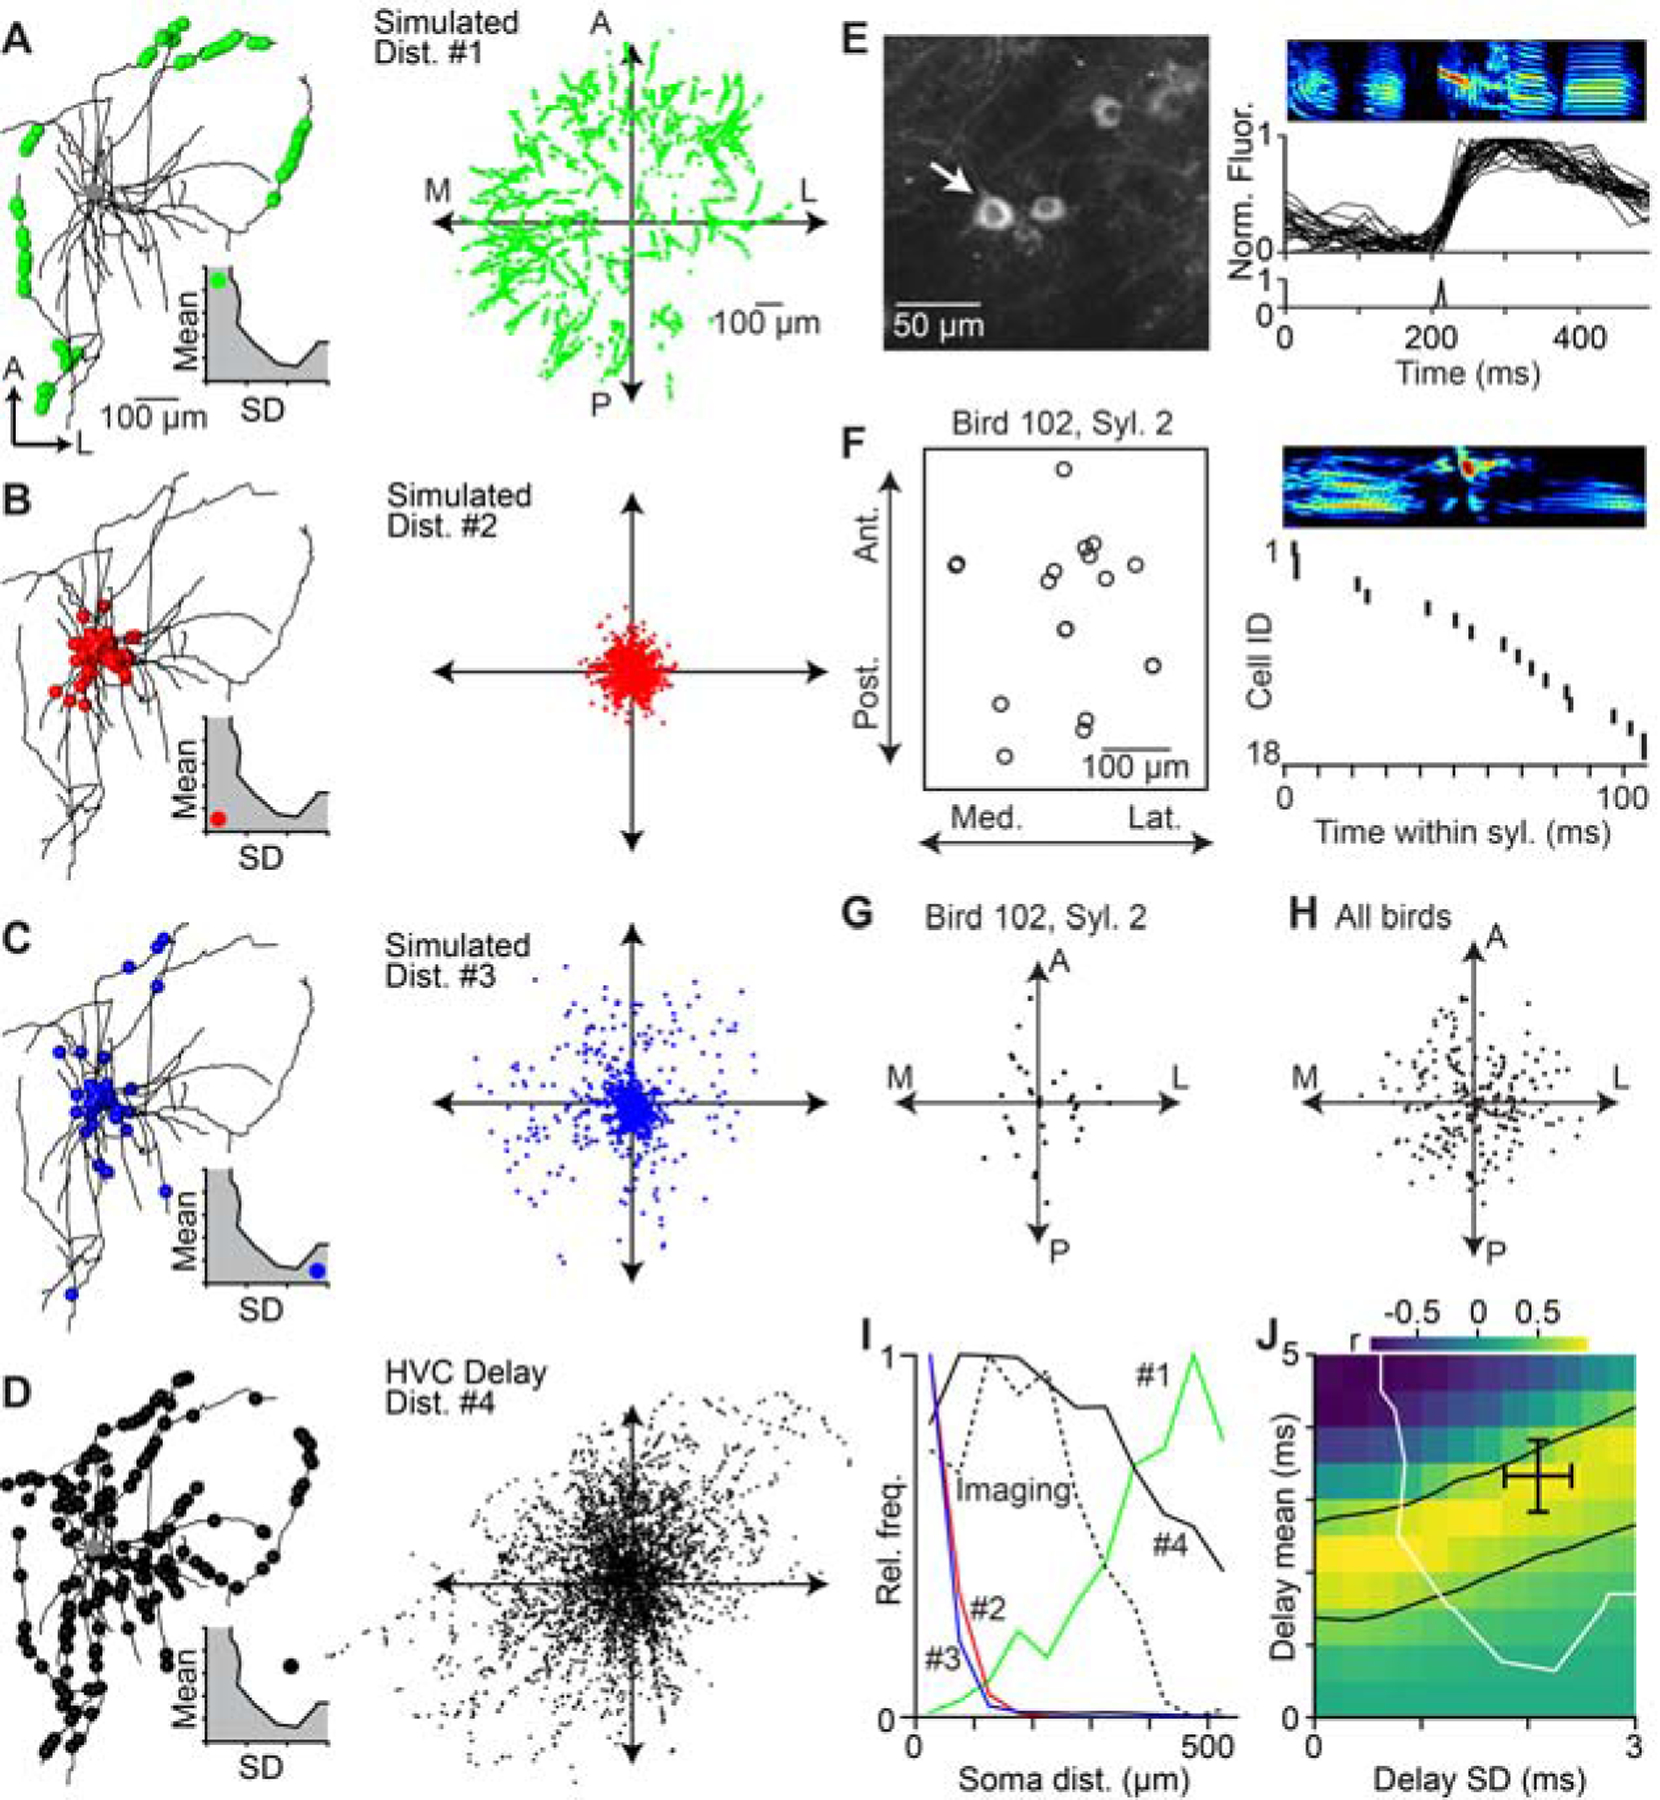
Figure 6. Spatial organization of HVC projection neuron activity during singing is consistent with network dynamics controlled by axonal delays.

(A–D) Left: Locations of virtual active synapses along the local axonal collaterals of an HVC(RA) neuron for a given delay distribution (inset; mean ± SD, a: 4.5 ± 0.25 ms; b: 0.5 ± 0.25 ms; c: 0.5 ± 2.75 ms; d: 3.3 ± 2.1 ms). Right: Distribution of virtual active synapses relative to the soma based on the local axonal collaterals of 22 HVC(RA) neurons. (E) 2-photon calcium imaging of song-related bursting activity in HVC. Left: Example image of GCaMP6s-labeled somata. Right: Spectrogram of song motif (top), aligned normalized fluorescence traces of the neuron highlighted in left panel (center), and estimated burst onset time (bottom). (F) Left: Soma locations of 18 neurons active within the same syllable, projected onto the horizontal plane. Right: Estimated burst onset times of the same neurons within the syllable. (G, H) Relative soma locations of sequentially active neurons in (F) (i.e., burst onset times within 20 ms of each other). Each dot is the relative soma location of a postsynaptic neuron and all presynaptic neurons are aligned at the origin. (G) Relative soma locations of putatively connected neurons in 9 birds (H). (I) Radial distribution of neurons in (H) (dashed line) and radial distribution of active synapses predicted by the four simulated distributions in A–D (solid lines). (J) Correlation between the radial distribution of sequentially active neurons (H) and simulated locations of active synapses for delay distributions covering the entire delay parameter space of network models (see Fig. 3G). The region between the black lines contains delay distributions that are significantly correlated with the measured distribution of sequentially active neurons (r ≥ 0.603, two-sided t-test: d.o.f. = 9, t ≥ 2.268, p ≤ 0.05). Black cross: estimated delays of HVC(RA) neurons (see Fig. 5F). Delay distributions to the right and above of the white line result in smooth sequences, as observed in HVC(RA) neuron population activity. See also Figure S6.
