
Figure 2: Candidate miRNAs were differentially expressed in peritoneal metastasis positive patients in the testing cohort.
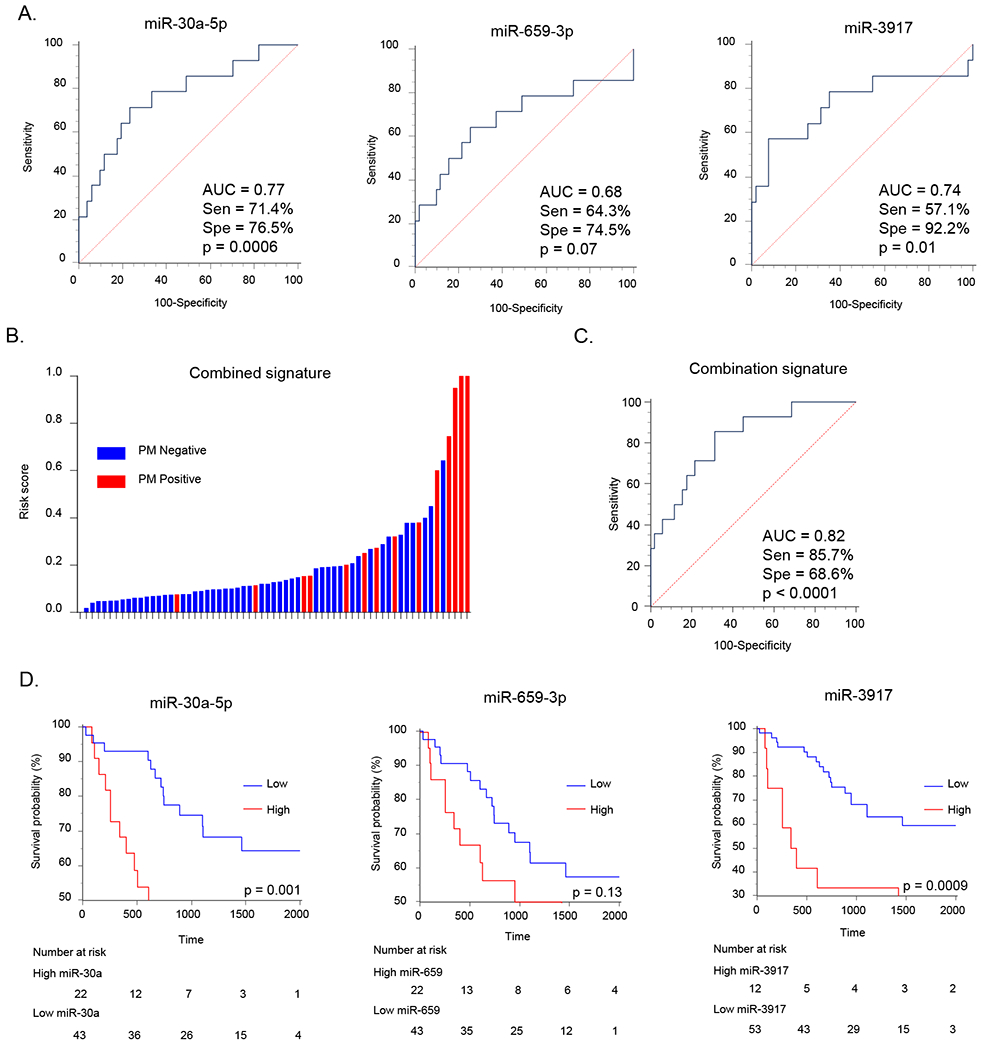
(A) Detection potential of miRNA candidates represented by receiver operating characteristic (ROC) curves. (B) The waterfall plot representing risk score of PM positive and negative patients based on the combined miRNAs signature. (C) ROC curve of the combined miRNA signature for the detection of PM. Abbreviations; Sen, sensitivity; Spe, specificity. (D) Kaplan-Meier analysis for overall survival (OS) between two groups dichotomized by Youden’s index for PM in individual overexpressing miRNAs.