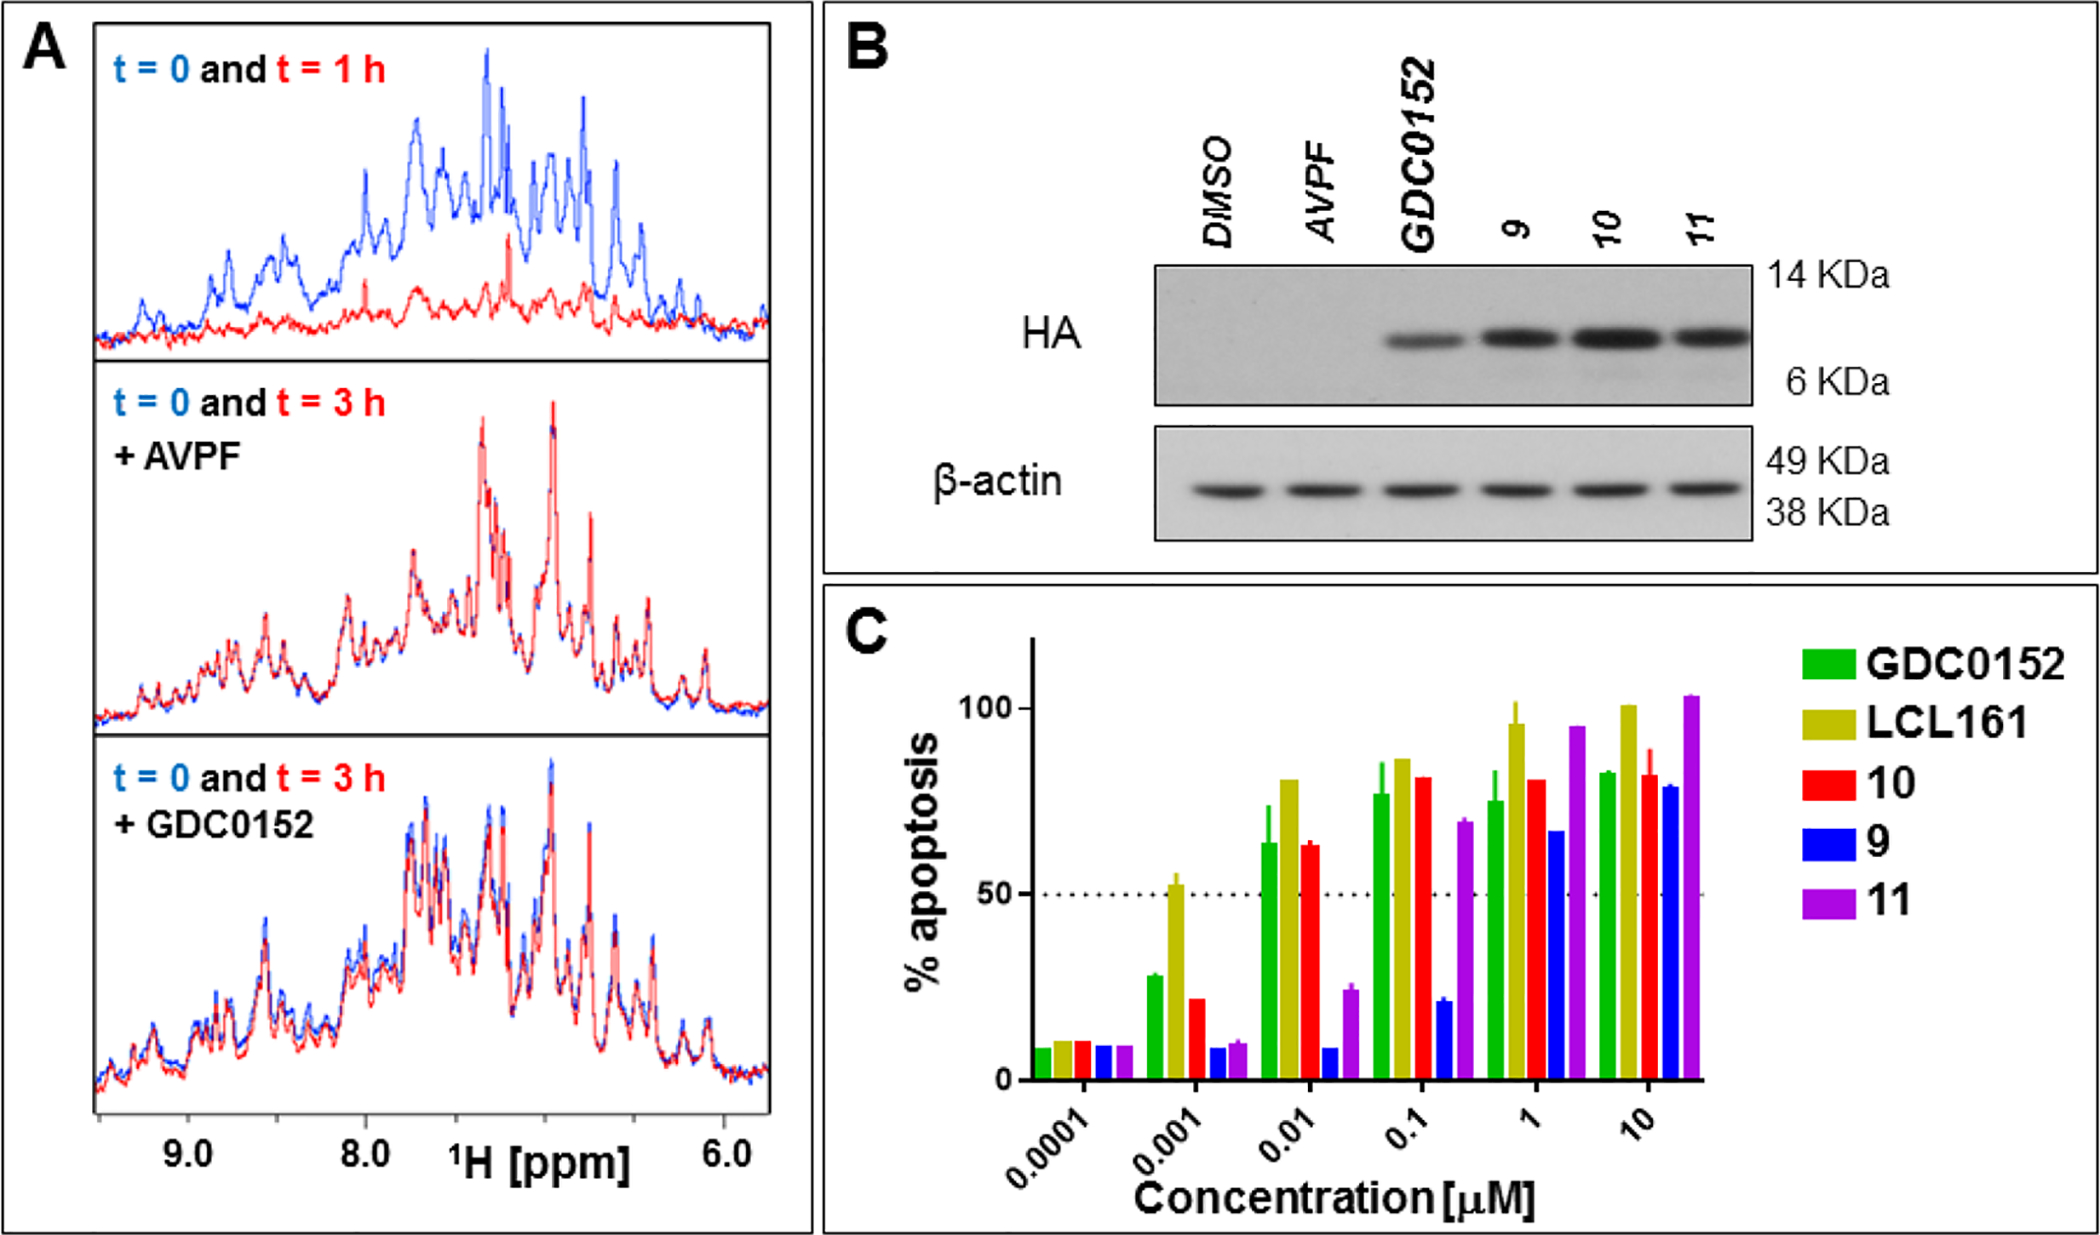
Figure 4. Cellular permeability and efficacy of selected agents.

A) 1H-1D NMR spectra of the amide/aromatic region of 20 μM BIR3 domain of XIAP in the apo form (top panel), in the presence of 40 μM of AVPF (middle panel), or in the presence of 40 μM of GDC0152 (bottom panel). The blue spectra were collected at time 0, the red the spectra were collected after 1 h at 37°C for the apo protein, and after 3h at 37°C in presence of AVPF, or GDC0152. B) Immunoblot of HEK293 expressing HA-tagged BIR3 domain of XIAP. The lysates were collected from cells that were exposed for 6 h to 10 μM of the indicated compounds. C) SKOV3 cells were exposed to different compounds at various concentrations. Subsequently, the plate was imaged by IncuCyte S3 live-cell analysis system and images were collected every 2 h for 48 h and data were analyzed using the IncuCyte S3 basic analyzer. The histogram represents data collected at 48 h.
