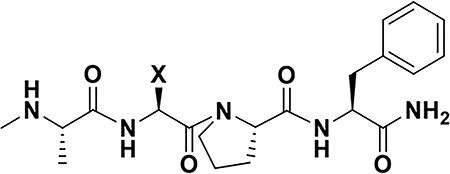
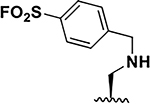
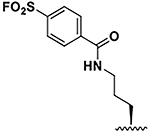
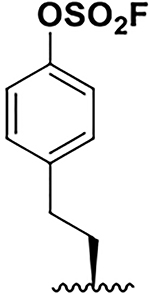
Table 2.
Displacement assays, thermal shift data for aryl-sulfonyl fluorides and aryl-fluoro sulfates tested against several XIAP BIR3 mutants.
 | |||||||||||||
|---|---|---|---|---|---|---|---|---|---|---|---|---|---|
| Agent | BIR3wt | Lys311Ala | Lys311Tyr | Lys311His | Lys311Thr | Lys311Ser | |||||||
| ID | X | IC50a [nM] |
ΔTm [°C]b |
IC50 [nM]a |
ΔTm [°C]b |
IC50 [nM]a |
ΔTm [°C]b |
IC50 [nM]a |
ΔTm [°C]b |
IC50 [nM]a |
ΔTm [°C]b |
IC50 [nM]a |
ΔTm [°C]b |
| 2 |  |
11 ± 1 13 ± 1 |
31 37 |
86 ± 2 59 ± 6 |
1.5 8.5 |
12 ± 2 10 ± 0.8 |
37.5 34.5 |
26 ± 0.1 21 ± 1 |
35.5 28.5 |
201 ± 1 72 ± 2 |
4.0 6.5 |
160 ± 8 80 ± 9 |
5 11 |
| 3 |  |
17 ± 0.1 8 ± 0.1 |
35.5 35 |
61 ± 4 27 ± 0.1 |
5 7.5d |
6.4 ± 0.1 3.5 ±0.1 |
36 33 |
62 ± 14 16 ± 1 |
31 28.5 |
161 ± 9 45 ± 2 |
5 6d |
145 ± 7 39 ± 1 |
5 7.5d |
| 4 |  |
71 ± 7 24 ± 1 |
8.5 33.0 |
65 ± 1 55 ± 0.2 |
11 13.5 |
37 ± 5 21 ± 2 |
8.5 35.5 |
113± 22 63 ± 4 |
11 12.5 |
140±20 120±10 |
9.5 11.5 |
177 ± 4 126 ± 2 |
10.5 14.5 |
| 5 |  |
190± 20 105± 10 |
11.5 16 |
86 ± 9 95 ± 4 |
10.5 11.5 |
55± 16 71 ± 8 |
10.5 11.5 |
137 ± 4 110 ± 3 |
8.5 8.5 |
231±20 220±10 |
8.5 9.5 |
241 ± 1 230± 10 |
6.5 13.5 |
| 6 |  |
140 ± 1 100 ± 5 |
11.5 15.0 |
89 ± 0.2 108 ± 6 |
10.5 11.5 |
63 ± 10 85 ± 4 |
10.5 11.5 |
140± 24 130± 10 |
11.5 12 |
240±12 220±20 |
7.5 9.5 |
250±1 276±14 |
8 13.5 |
| 7 |  |
590± 65 100 ± 7 |
4.5 31c |
218 ±8 270± 25 |
8 8.5 |
113 ± 2 48 ± 6 |
5.5 32 |
270±70 260±20 |
36.5e 38e |
620±40 630±20 |
5.5 6.5 |
713± 3 646± 32 |
8.5 10.5 |
| 8 |  |
2000± 20 90 ± 1 |
11.5 28.5c |
70 ± 2 70 ± 7 |
11 12.5 |
80 ± 2 86 ± 13 |
10.5 29.5c |
126± 14 98 ± 1 |
11 29.5c |
180± 40 165± 3 |
8.5 10 |
250± 1 237± 13 |
10.5 10.5 |
IC50 values represent dose-response curves obtained after incubating protein and ligand for 2 h or 8 h at room temperature.
Thermal shift (ΔTm) data were obtained incubating protein and ligand for 2 h at room temperature or 6 h at 37°C. The data reported represent the major peak observed (see supplementary information for individual curves).
In this experiment, the peak corresponding to the non-covalent ΔTm is still present.
An additional smaller peak that corresponds to a ΔTm ~30 °C is observed perhaps due to a covalent interaction with Lys322.
In this experiment the shift reported corresponds to a minor peak.
