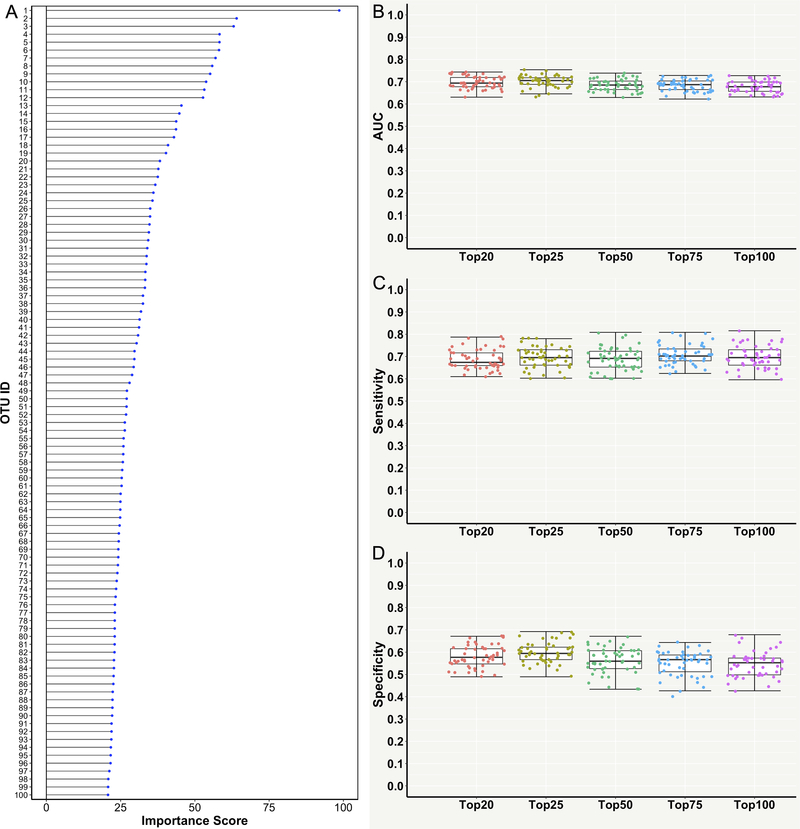
Figure 4. Performance measures of the random forest (RF) model for classifying the cardiovascular disease (CVD) and non-CVD subjects using the top highly contributing operational taxonomic unit features (HCOFs).
(A) Variable importance scores (ranged from 0 to 100) of the top 100 HCOFs. (B) Area under the receiver operating characteristic curve (AUC). (C) Sensitivity. (D) Specificity. Each point in the box plot represents the corresponding performance measure in one iteration (total 50 iterations).

