Figure 5.
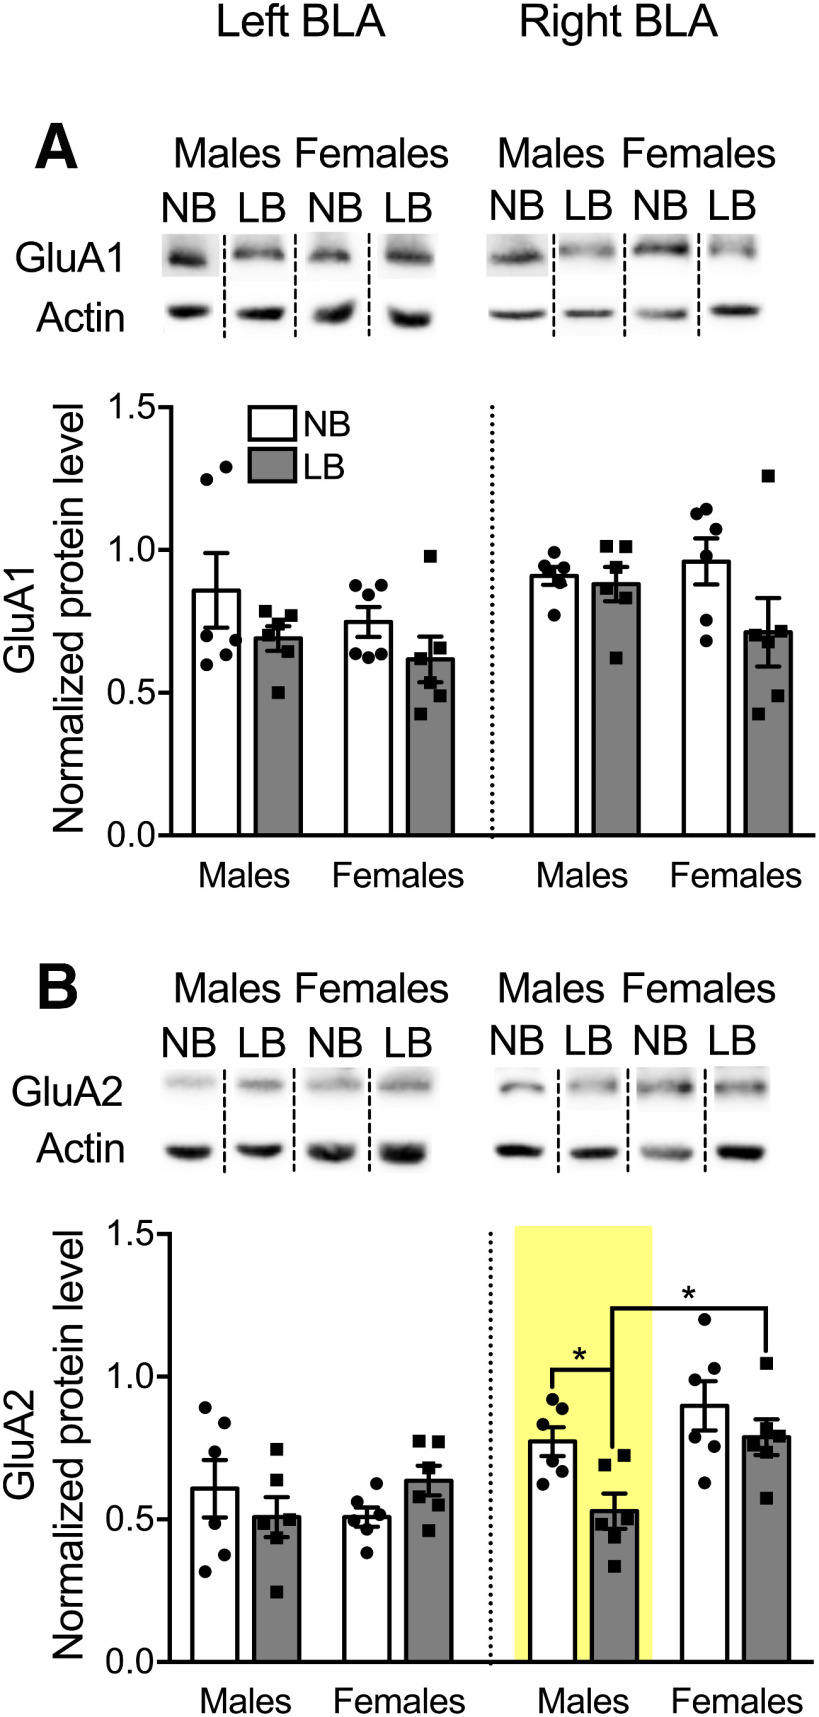
Expression of AMPAR subunits GluA1 and GluA2 in the left and right BLA of PND28-PND29 animals. Protein levels were normalized to actin, and representative Western blot bands are displayed above each graph. Dashed lines are used to divide bands from different parts of the same or different gels. Samples originating from male and female offspring were run on different gels. A, GluA1 expression was unaffected by LB conditions. B, GluA2 expression was significantly decreased in LB males compared with NB males (p = 0.017) and LB females (p = 0.012), only in the right BLA. Two-way ANOVAs with bedding and sex as between-subject factors were performed by side and followed by simple effects tests to decompose significant interactions. Data are mean ± SEM of n = 5 or 6 animals/group. *p < 0.05.

