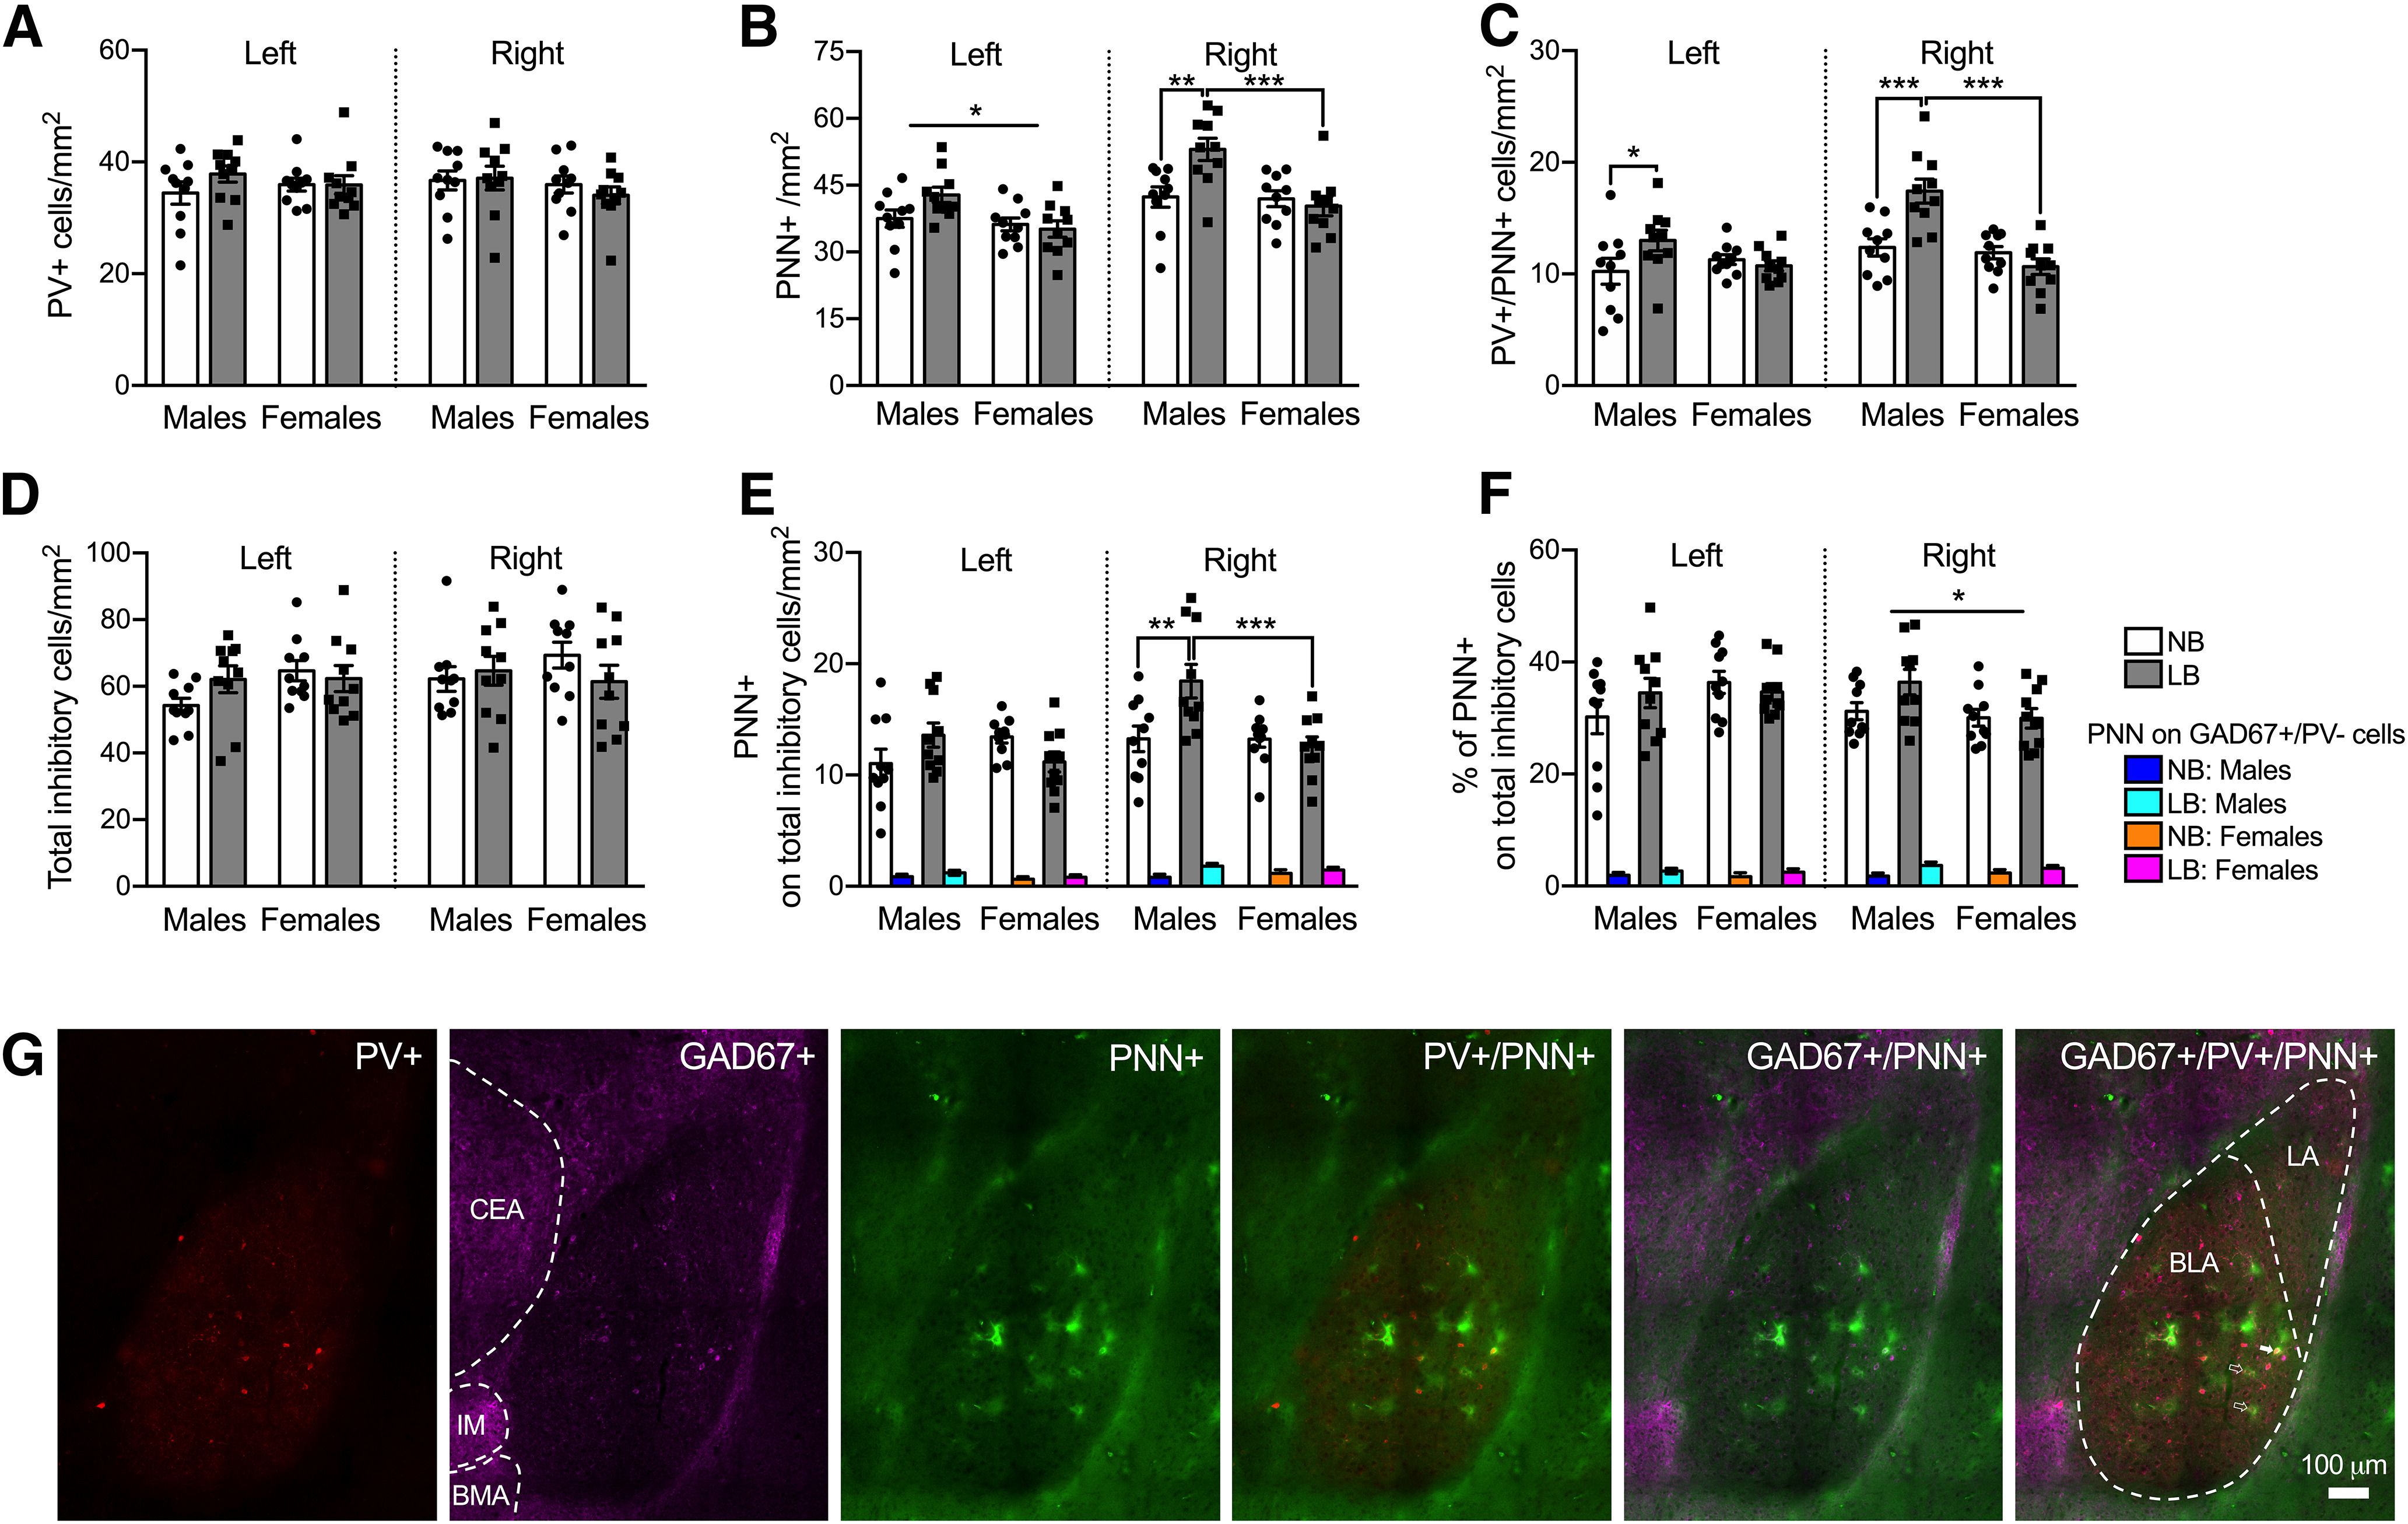
Figure 7.

PV+ interneuron, total inhibitory (GAD-67+) cell population, and PNN expression in the left and right BLA of male and female juvenile rats on PND28-PND29. E, F, Colored bars (blue, turquoise, orange, magenta) represent PNN on GAD67+/PV– cells. A, Early bedding conditions did not affect PV+ cell density in the left or right BLA in either sex. B, In the left BLA, PNN density was heightened in males compared with females. Simple effects tests showed that LB males had significantly increased PNN density in the right BLA compared with NB males (p = 0.0015) and LB females (p = 0.00025). C, In the left (p = 0.02) and right BLA (p = 0.00008), LB-exposed male rats expressed more PV+ cells ensheathed with PNN than NB males. Only in the right BLA did LB males display more PV+/PNN+ cells relative to LB females (p = 0.00001). D, The density of total inhibitory cells was not affected by sex or bedding in either side of the BLA. E, In the right BLA only, LB males displayed more PNN on the total inhibitory cell population compared with NB males (p = 0.0021) and LB females (p = 0.0006). The density of PNN surrounding GAD67+/PV– cells was increased in LB (turquoise and magenta bars) versus NB animals (blue and orange bars) (p = 0.022), again only on the right side. F, In the right BLA exclusively, males showed greater percentages of PNN on the total inhibitory cell population relative to females. LB animals (turquoise and magenta bars) had a higher percentage of PNN on GAD67+/PV– cells compared with NB animals (blue and orange bars) in the right (p = 0.021), but not the left, BLA. G, Representative fluorescence microscopy images (20× magnification) taken from the right BLA (bregma −2.04) in LB male pups showing PV+ (red), GAD67+ (pink), and PNN+ (green) cells and the merged expression of PV+/PNN+, GAD67+/PNN+, and GAD67+/PV+/PNN+ cells. The BLA and LA are outlined in the GAD67+/PV+/PNN+ image. Solid arrowhead indicates a GAD67+/PV+/PNN+ cell. Clear arrowheads indicate PNN+ cells not surrounding any labeled inhibitory cell. The central amygdala (CeA), intercalated amygdala nucleus (IM), and basomedial amygdala (BMA) are outlined in the GAD67+ image. Data are mean ± SEM of n = 10 animals/group (8 sections per amygdala side for A-C, 4 sections per amygdala side for D-F, control and fear group animals combined). Scale bar, 100 µm. Two-way ANOVAs with bedding and sex as between-subject factors were performed and followed by simple effects tests to decompose significant interactions. *p < 0.05. **p < 0.01. ***p < 0.001.
