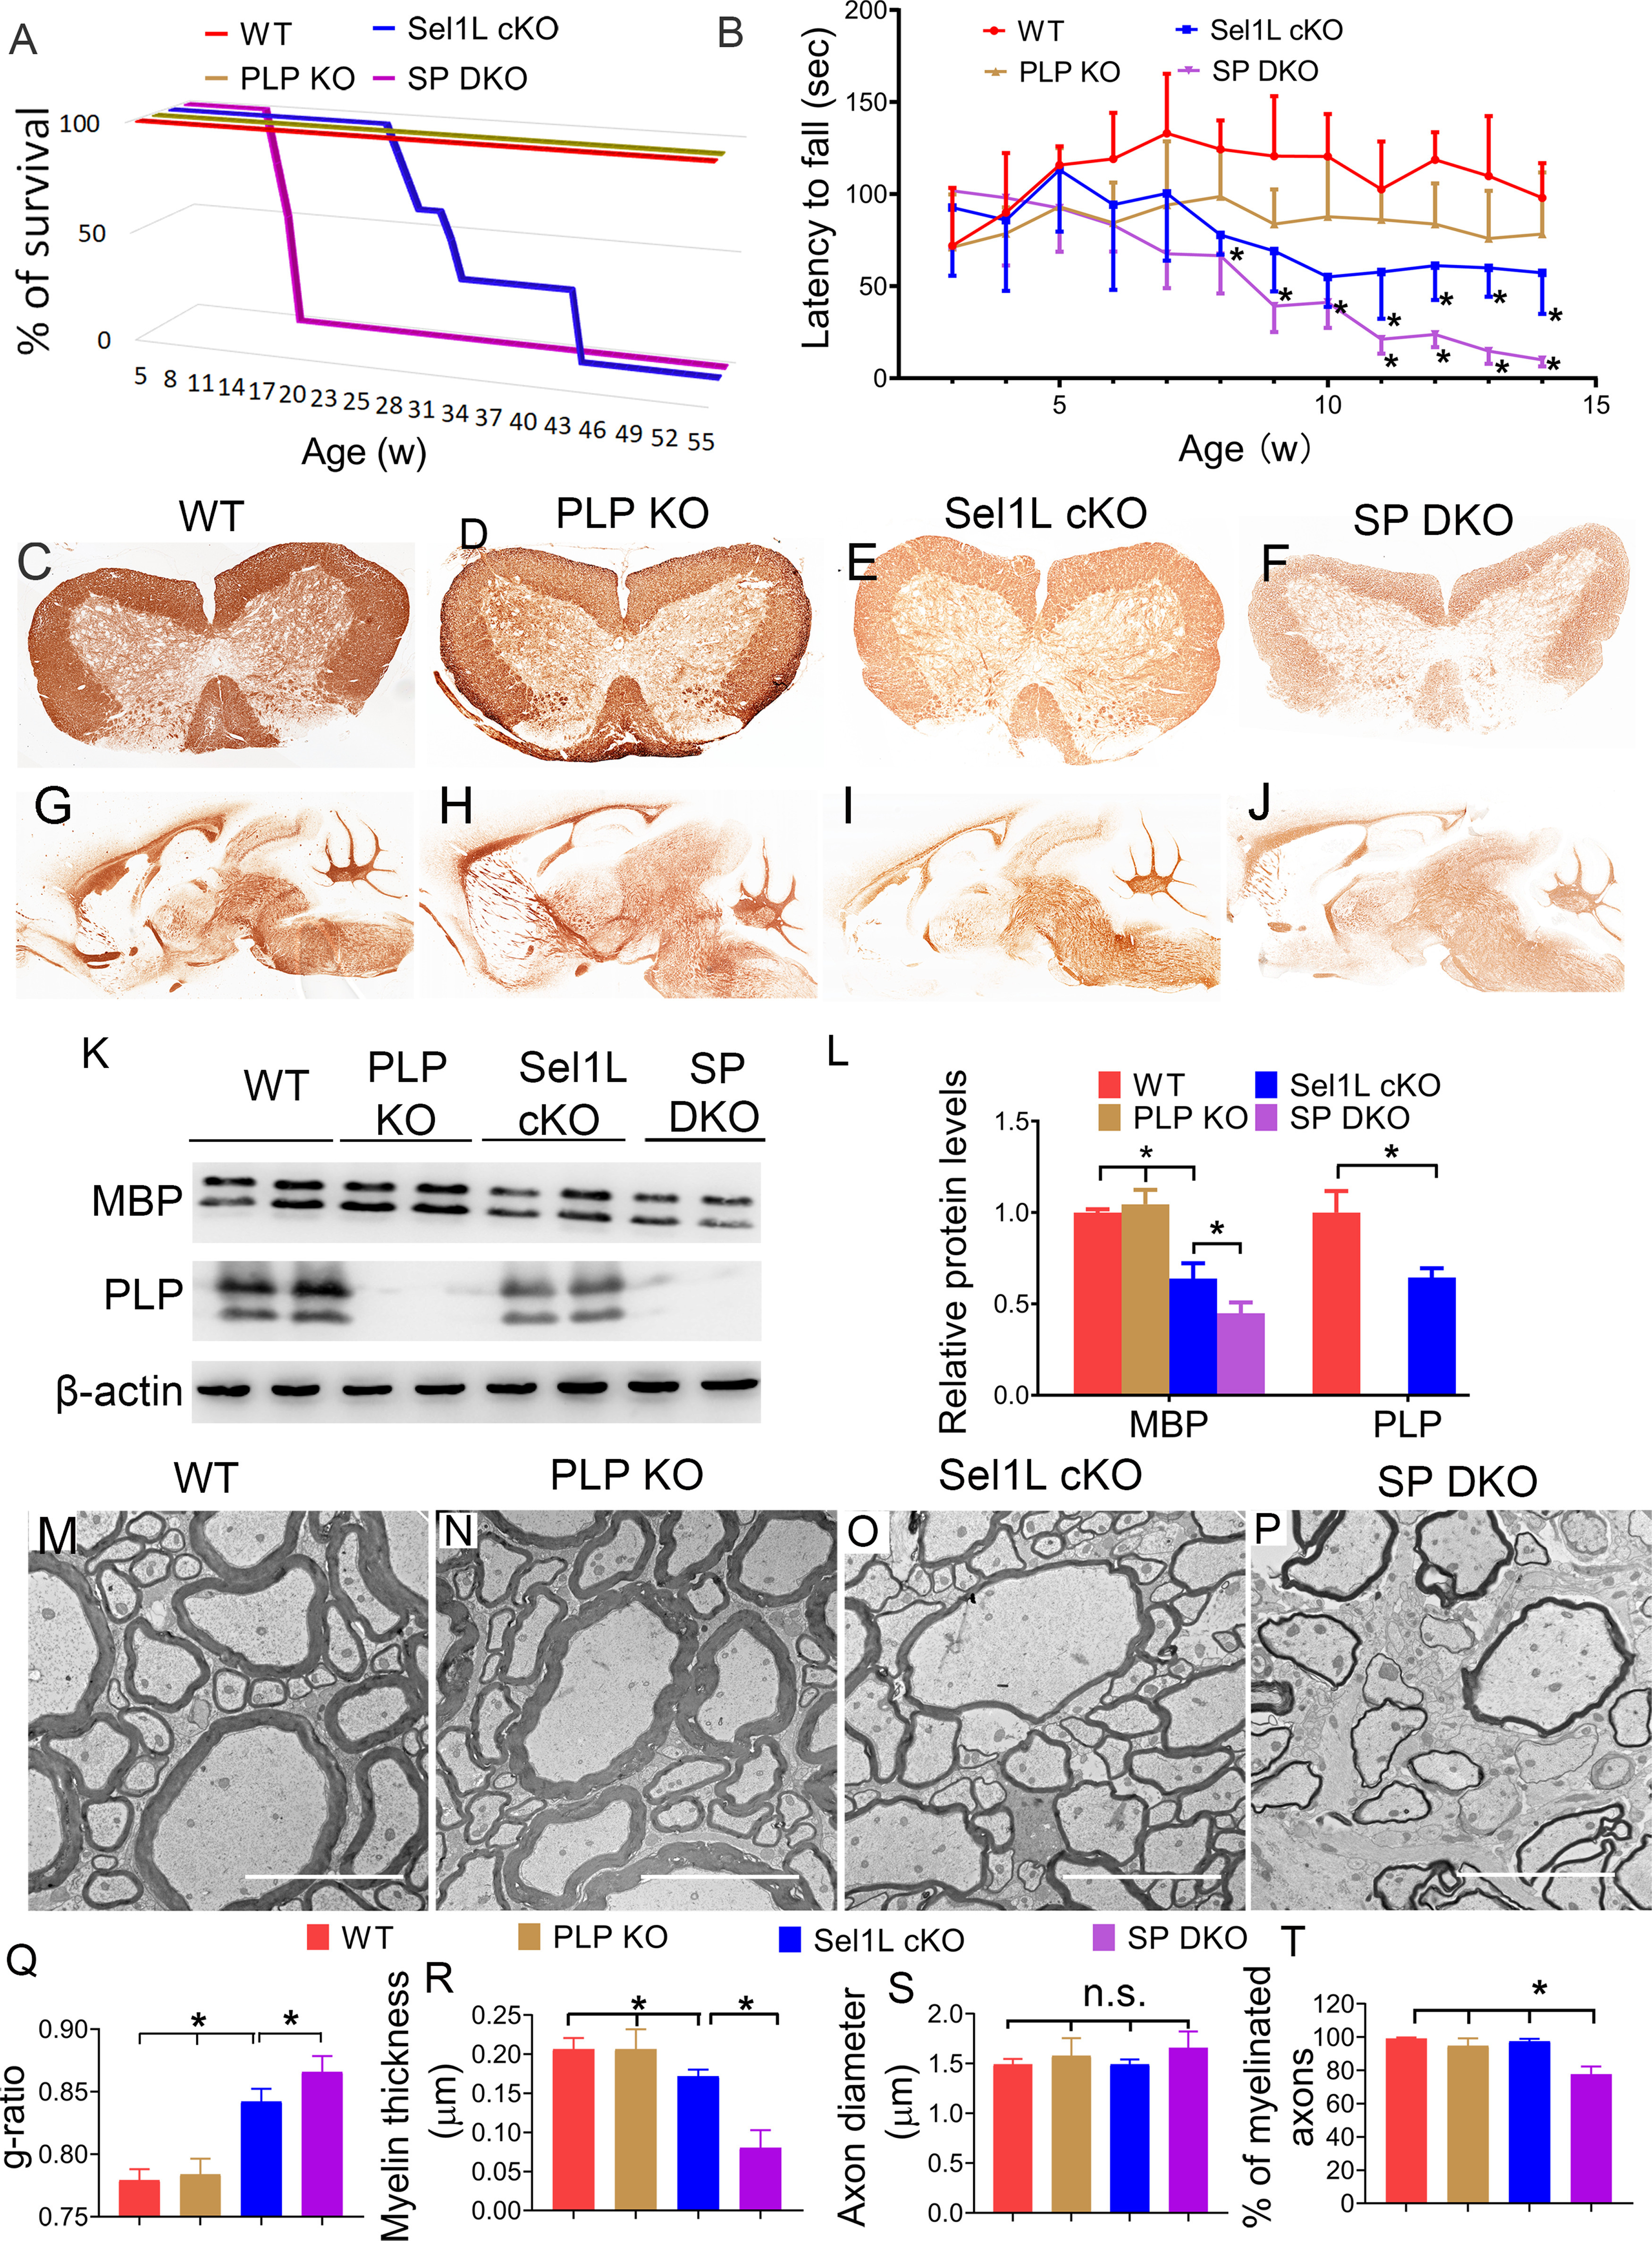
Figure 10.

PLP deficiency exacerbated myelin thinning in the CNS of adult Sel1L cKO mice. A, Mouse survival curve showed that WT mice and PLP KO mice survive at least 1 year. All Sel1L cKO mice died by 43 weeks. Importantly, all SP DKO mice died by 16 weeks. N = 8 animals. B, Rotarod test showed that the latency to fall of Sel1L cKO mice was significantly shorter than WT mice starting at the age of 8 weeks, and that the latency to fall of SP DKO mice was significantly shorter than Sel1L cKO starting at the age of 11 weeks (significant effect of group, F(3,22) = 33.49; significant effect of age, F(6.018,132.4) = 7.886; and significant group × age interaction, F(3242) = 3.398). N = 6-8 animals. C–J, MBP IHC showed that the immunoreactivity of MBP is noticeably decreased in the spinal cord and brain of 10-week-old Sel1L cKO mice compared with PLP KO mice and WT mice. PLP deficiency further reduced the immunoreactivity of MBP in Sel1L cKO mice. K, L, Western blot analysis showed that PLP was undetectable in the brain of 10-week-old PLP KO mice and SP DKO mice. The level of MBP was significantly decreased in the brain of 10-week-old Sel1L cKO mice compared with PLP KO mice and WT mice, and was further reduced in SP DKO mice. M–T, EM analysis showed a significant increase in the g-ratio (F(3,12) = 58.66) and a significant reduction in myelin thickness (F(3,12) = 39.77) in the spinal cord of 10-week-old Sel1L cKO mice compared with PLP KO mice and WT mice. PLP deficiency further increased the g-ratio and further reduced myelin thickness in Sel1L cKO mice. Moreover, the percentage of myelinated axons was significantly decreased in the spinal cord of 10-week-old SP DKO mice compared with Sel1L cKO mice, PLP KO mice, and WT mice (F(3,12) = 35.85). Conversely, the diameter of axons was comparable in the spinal cord of 10-week-old SP DKO mice, Sel1L cKO mice, PLP KO mice, and WT mice (F(3,12) = 1.560). Scale bars: M-P, 5 µm. N = 4 animals. Statistical analyses were done with a one-way ANOVA with a Tukey's post-test or a two-way ANOVA with a Bonferroni post-test. Error bars indicate SD. *p < 0.05. n.s. not significant.
