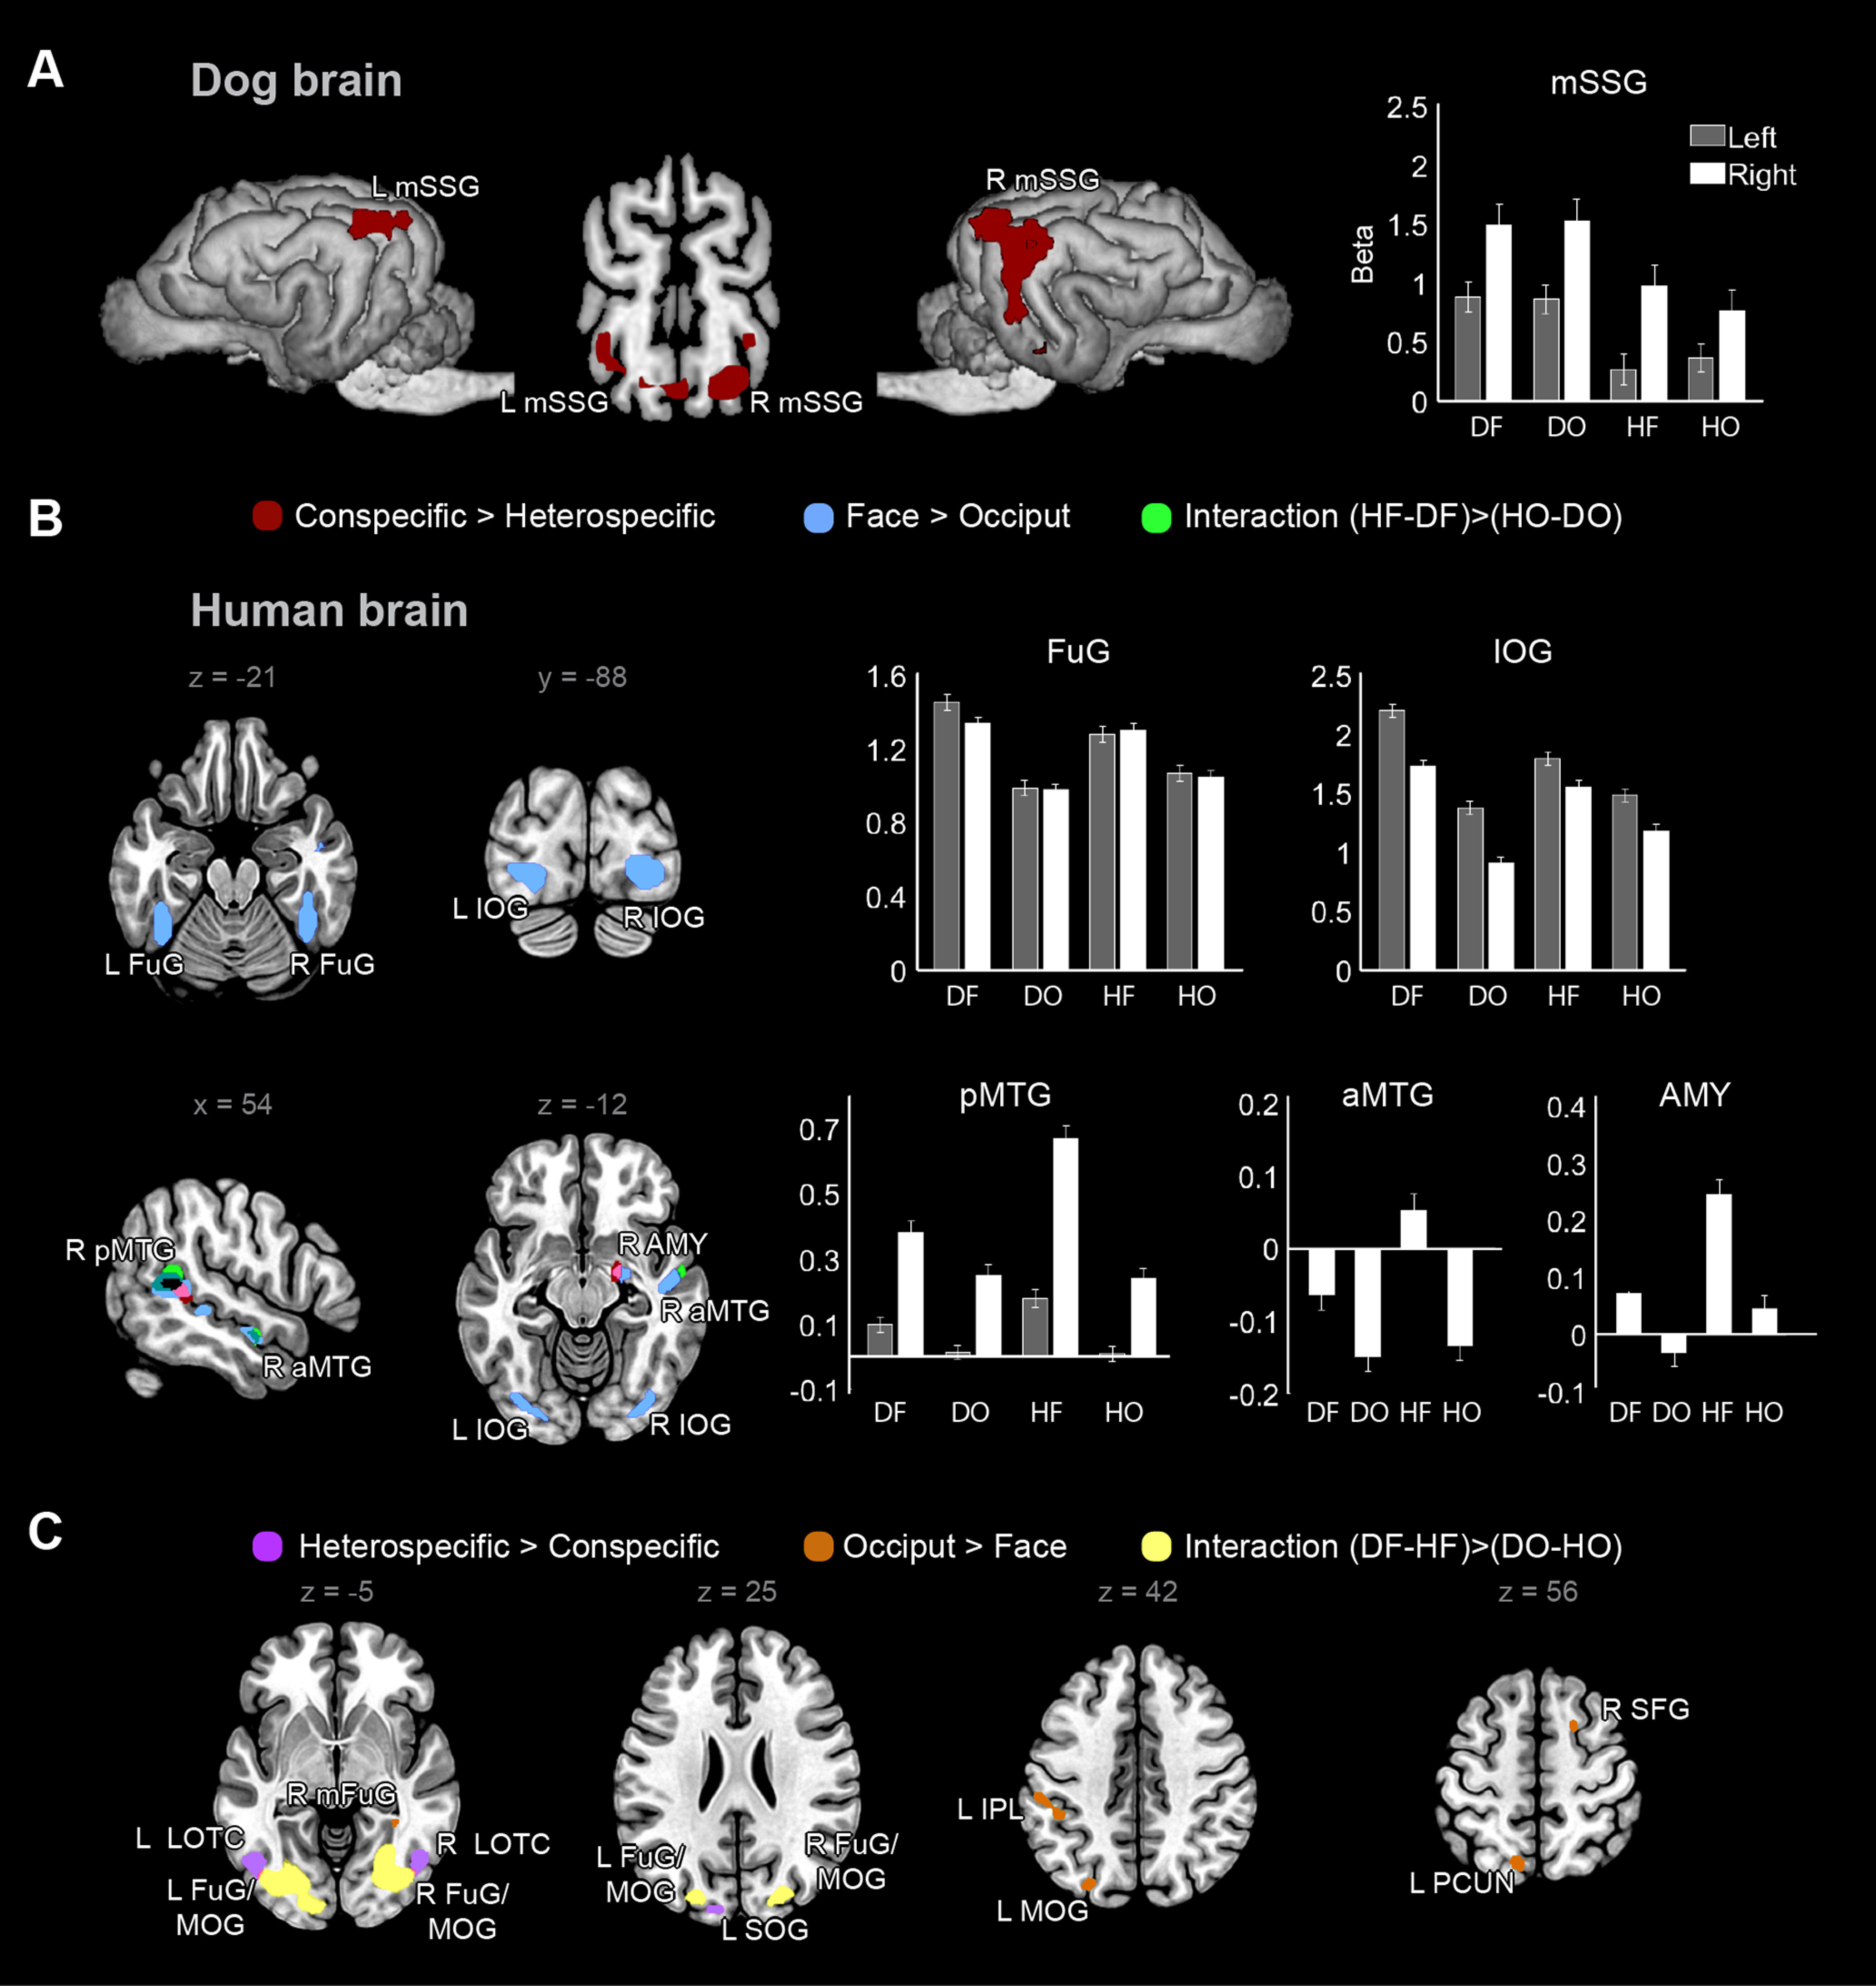
Figure 1.

GLM results in dogs (n = 20) and humans (n = 30). A, Dog contrast maps superimposed on a template brain (Czeibert et al., 2019). Threshold was p < 0.001 uncorrected and p < 0.05 cluster-corrected for FWE. None of the other main or interaction contrasts yielded significant effects. The bar graph represents parameter estimates (β weights) in select GLM-derived peaks (sphere radius = 4 mm) to each condition; error bars represent SE. B, C, Human contrast maps (main and interaction effects) superimposed on a template brain. Threshold was p < 0.000001 uncorrected and p < 0.001 cluster-corrected for FWE. B, Conspecific>heterospecific, face>occiput, and their interaction. The bar graphs represent parameter estimates (β weights) in select GLM-derived peaks (sphere radius = 8 mm) to each condition; error bars represent SE. C, Heterospecific>conspecific, occiput>face, and their interaction. D = dog; H = human; F = face; O = occiput; L = left; R = right; mSSG = mid suprasylvian gyrus; AMY = amygdala/hippocampus; aMTG = anterior middle temporal gyrus; FuG = fusiform gyrus; FuG/MOG = a cluster including parts of FuG, IOG, MOG and SOG; IOG = inferior occipital gyrus; IPL = inferior parietal lobule; LOTC = lateral occipitotemporal cortex; mFuG = medial fusiform gyrus; MOG = middle occipital gyrus; PCUN = precuneus; pMTG = posterior middle temporal gyrus; SFG = superior frontal gyrus; SOG = superior occipital gyrus, extending to cuneus.
