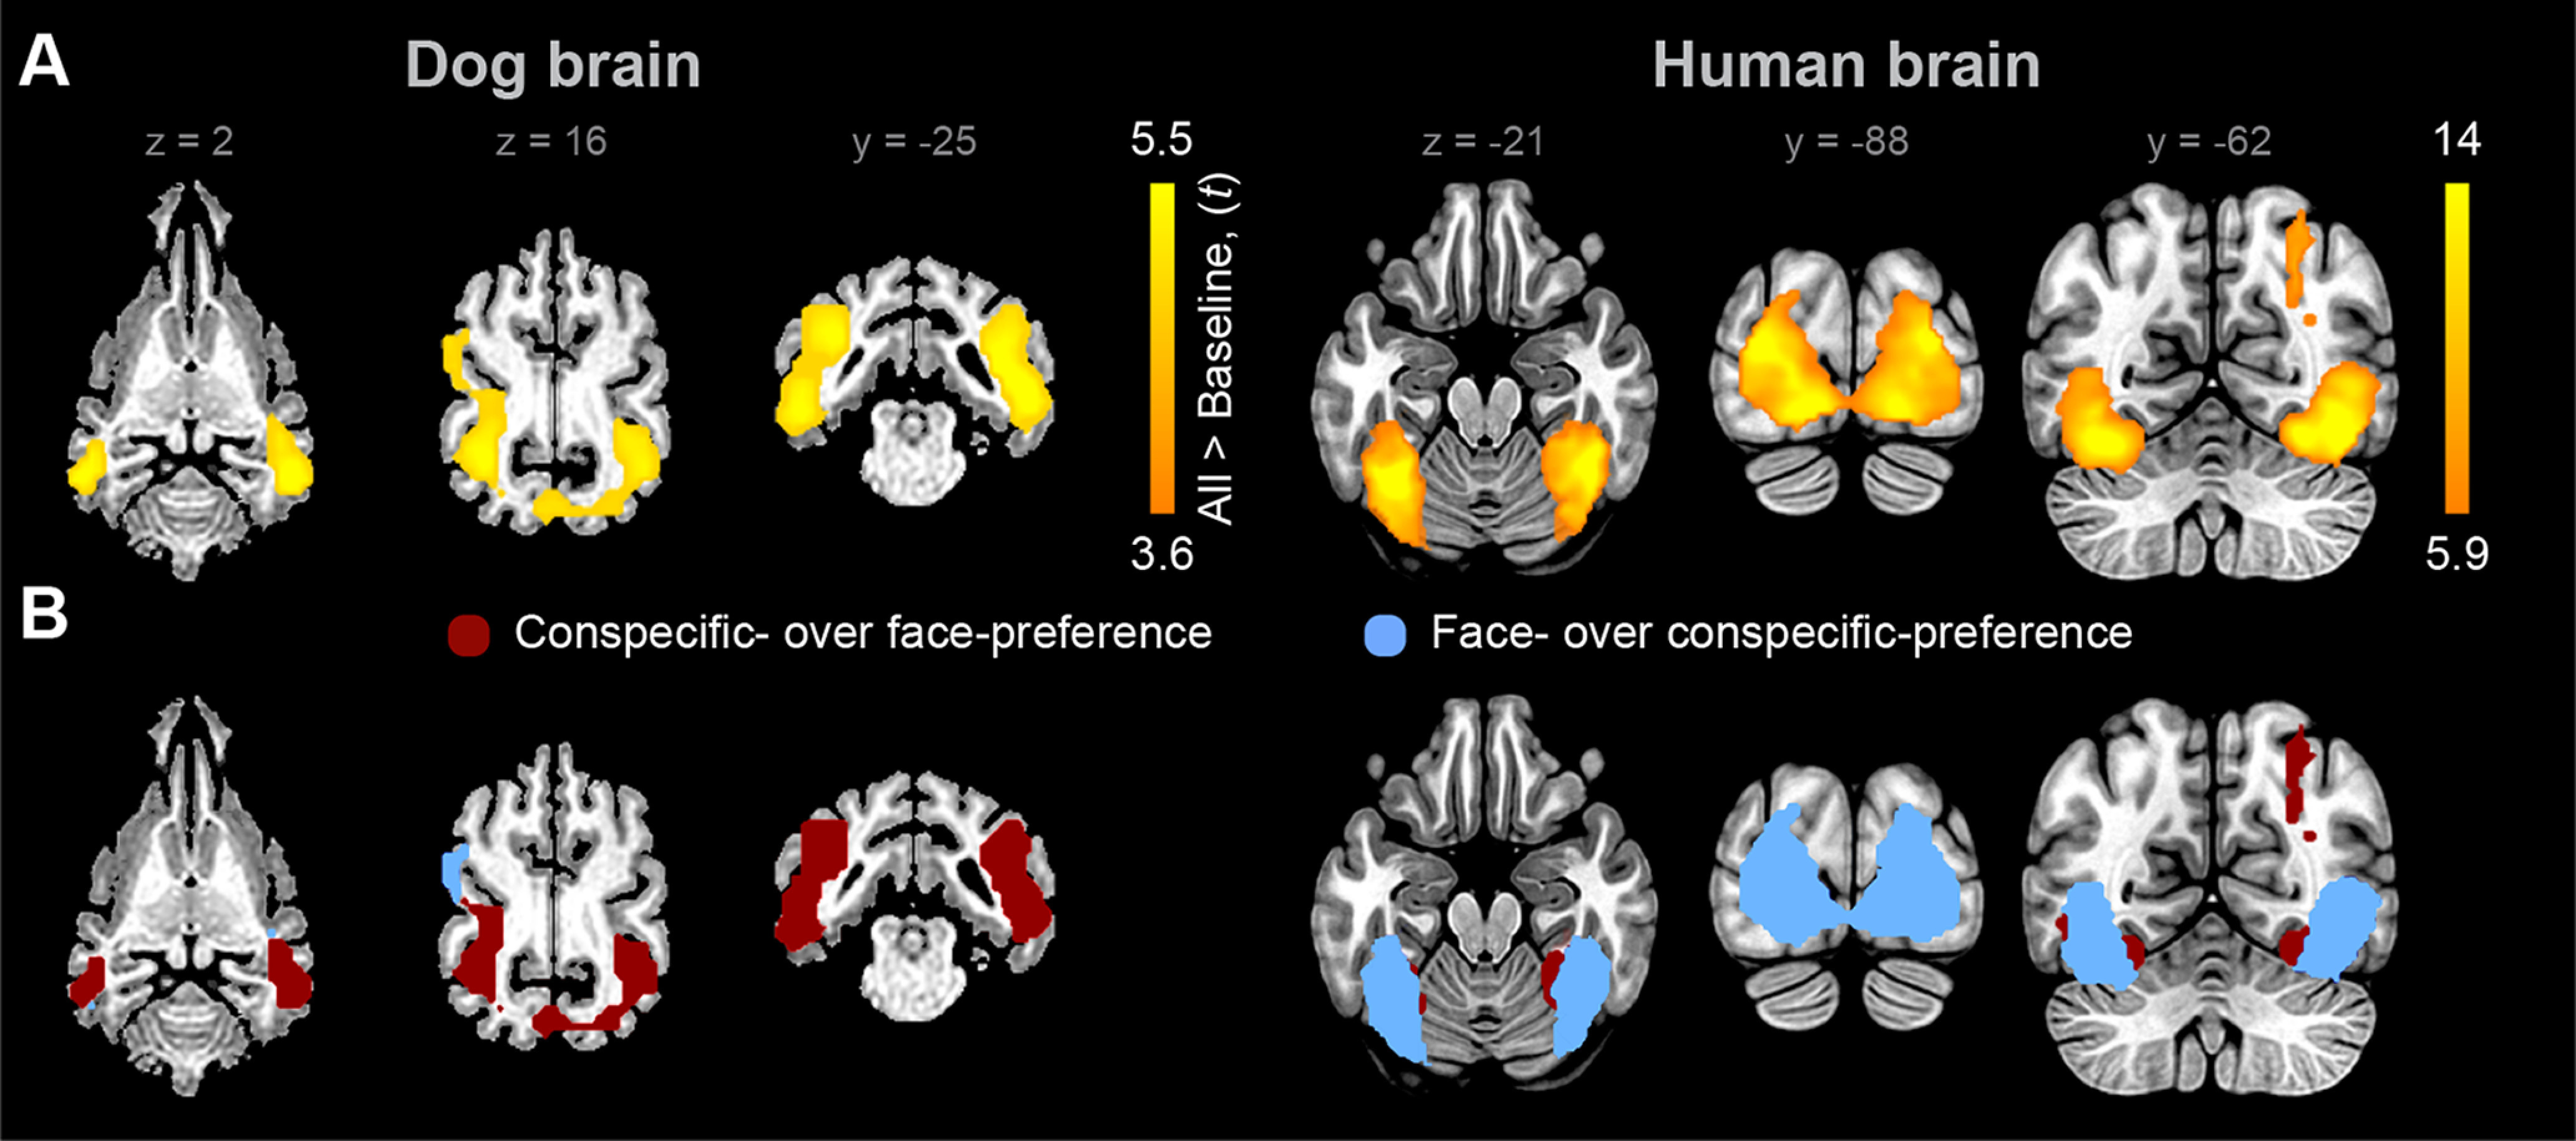
Figure 2.

Visually-responsive regions and processing preference differences in dogs and humans. A, Visually-responsive regions (color coded with warm) as determined by the contrast of experimental conditions versus fixation baseline in the dog brain (left), thresholded at p < 0.001 uncorrected and p < 0.05 cluster-corrected for FWE and in the human brain (right), thresholded at p < 0.000001 uncorrected and p < 0.001 cluster-corrected for FWE. B, Group-level binary map of stronger conspecific-preference than face-preference (red) and stronger face-preference than conspecific-preference (blue) in visually-responsive regions. See Results for corresponding permutation statistics comparing the proportions of voxels with either preference and on random effects analyses of individual binary preference maps. See also Extended Data Figures 2-1, 2-2.
