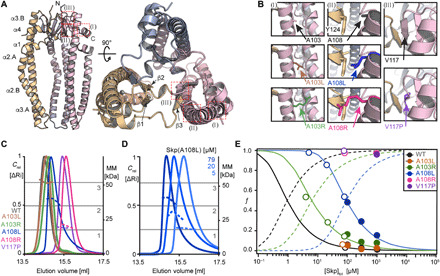
Fig. 1. Identification of Skp mutations that perturb the monomer-trimer equilibrium.

(A) Location of the mutation sites [red boxes (I), (II), and (III)], displayed on the Skp crystal structure (Protein Data Bank: 1SG2). Secondary structure elements and termini are indicated. (B) Close-up of the interface between Skp subunits, highlighting the position of the five mutations. See text for details. (C) SEC elution profiles (solid lines, left axis) and MALS apparent molecular mass (MM) (dotted lines, right axis) at elution concentrations of ≃80 μM and a temperature of 25°C. Dark gray, Skp(WT); brown, Skp(A103L); green, Skp(A103R); blue, Skp(A108L); magenta, Skp(A108R); purple, Skp(V117P). Gray horizontal lines indicate the molecular masses of monomers, dimers, and trimers of Skp. (D) Experiment as in (C) for Skp(A108L) as a function of the elution concentrations: 5, 20, and 79 μM. (E) Fractional populations f of monomers in the monomer-trimer equilibrium as a function of total Skp concentration. Experimental data points from NMR and SEC-MALS are indicated by filled and open circles, respectively. These have been fitted by Eq. 4 for mutants A103R and A108L (solid lines). The corresponding fractional populations of the trimeric state, 1 − f, are shown by dashed lines. Note that the concentration of Skp trimers equals one-third of the concentration of Skp molecules in the trimeric state, i.e., [Skp]trimer = 1/3 · (1 − f) · [Skp]tot. For Skp(WT) and Skp(A103L), the data follow the WT association constant published by Sandlin et al. (37).
