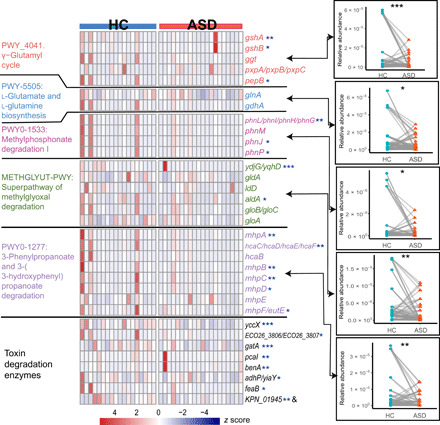
Fig. 2. ASD-associated detoxifying enzymes and pathways.

The heatmap shows the relative abundance of each detoxifying enzyme in each sample involved in the paired cohort. Colors indicate the relative abundance that is normalized with z score. Names of pathway modules and representative genes in Enterobacteriaceae of the enzyme are labeled on the left and right sides of the heatmap, respectively. Comparisons of the relative abundance of pathways between controls and ASD subjects are shown to the right side of the heatmap and linked to corresponding pathways with arrows. Significance was tested with Wilcoxon signed-rank test; *P < 0.05, **P < 0.01, and ***P < 0.001. HC, healthy control.
