
Fig. 3. The correlation of detoxifying enzymes to urine biomarkers of mitochondrial dysfunction.
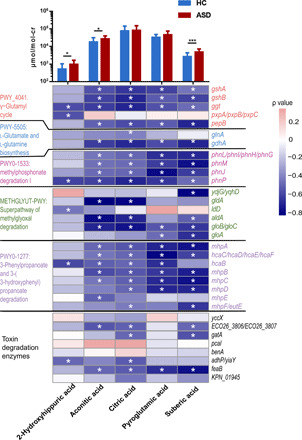
(Top) Average concentrations of each urine biomarker of mitochondrial dysfunction (labeled below the heatmap) in ASD and control samples. The y axis indicates their concentrations (μmol normalized by the concentration of creatine of the same sample). Significance was labeled with *P < 0.05 and ***P < 0.001 on the basis of a Wilcoxon signed-sum test. (Bottom) Heatmap of correlations between each detoxifying enzyme and urine biomarker. The color indicates the ρ value of the Spearman rank test, *ρ ≥ 0.4 or ρ ≤ −0.4.