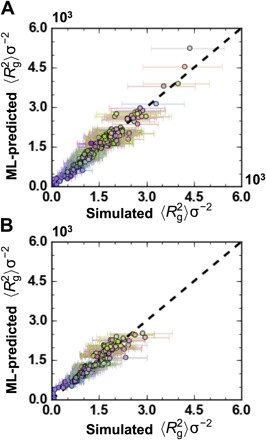
Fig. 3. Performance of ML model for prediction of mean square radius of gyration, 〈Rg2〉, for class I and class II polymers.

In (A), an ML model is trained on 80% of the sequences, and the predictions for 〈Rg2〉 versus simulated 〈Rg2〉 are shown for the 308 held-out sequences; the r2 is 0.953, and the MAE is 111.32σ2. In (B), a model trained on class I polymers is applied to make predictions on the class II polymers; the r2 is 0.895, and the MAE is 130.34σ2. The coloring of the markers reflects the polymer composition as described in the “Data coloring by composition” section in Materials and Methods.
