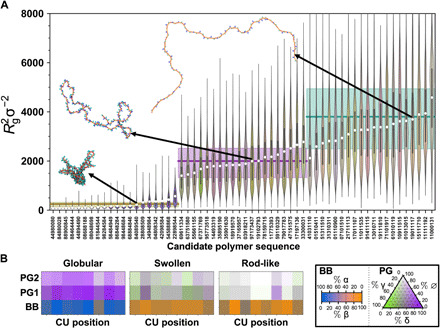
Fig. 5. Targeted sequence design of size-specific polymers.

(A) Statistical comparison of 〈Rg2〉 distributions obtained from explicit MD simulations of all candidate polymers. (B) Average composition maps of the CUs for candidate rod-like, swollen, and globular targets with 〈Rg2〉σ−2 = 3800 (top), 2000 (middle), and 250 (bottom). In (A), from left to right, the first 20 sequences are the globular targets, the next 20 are the swollen targets, and the remaining 20 are the rod-like targets; within each set, the sequences are ordered by ascending 〈Rg2〉, given by the white dots. The violin plots indicate the distribution of values underlying the mean, with a notch at the median value and a bar extending from the 25th to the 75th percentile values. For reference, the target value is indicated by the horizontal line, and the shaded region indicates the average spread between 25th and 75th percentiles for class I polymers of similar size. The color of each violin is based on the average composition of the total polymer sequence. In (B), the colors are resolved by CU and backbone/pendant group but averaged over all sequences for each specific target size. The color contributions for each bead type are shown in the boxed legend, with ∅ indicating no bead present.
