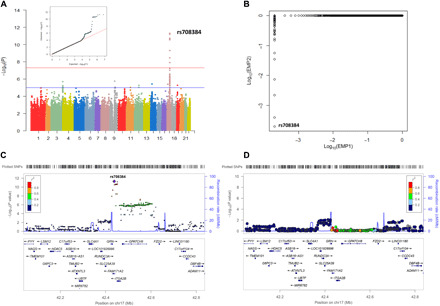
Fig. 1. GWAS results and regional plots for associations with CSF PGRN levels.

(A) Manhattan plots [showing the −log10 (P value) for individual SNP] and q-q plot. (B) Association results after permutation test. EMP1, empiric P value; EMP2, permutation-based corrected empiric family-wise error rate. (C) Regional association results for the GRN-FAM171A2-ITGA2B region. (D) Regional association results after controlling for rs708384.
