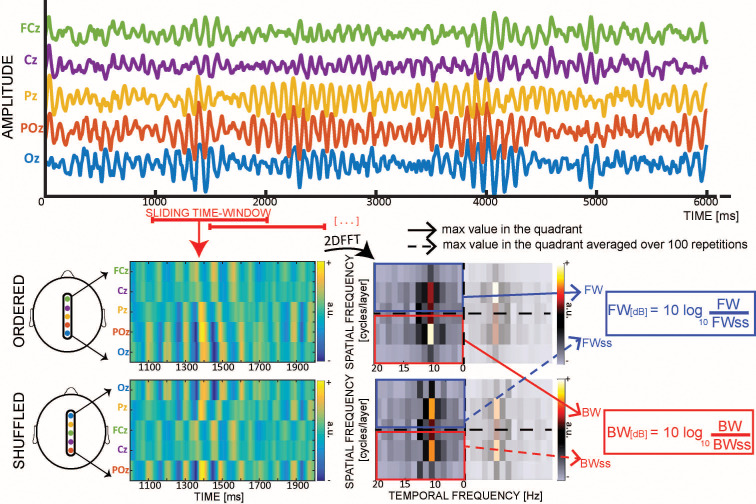
Figure 1. Quantifying cortical waves.
From each 1 s EEG epoch we extract a 2D-map, obtained by stacking signals from five midline electrodes. For each map we compute a 2D-FFT in which the maximum values in the upper- and lower-left quadrants represent respectively the amount of forward (FW – in blue) and backward (BW – in red) waves. For each map, we also compute surrogate values by shuffling the electrodes’ order 100 times, so as to retain temporal fluctuations while disrupting the spatial structure of the signals (including any travelling waves). Eventually, we compute the wave strength in decibel (dB) by combining the real and the surrogate values.

