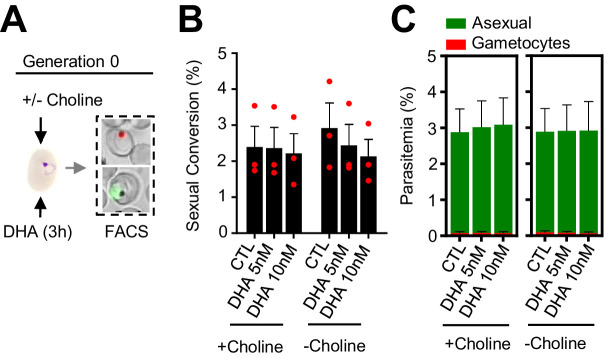
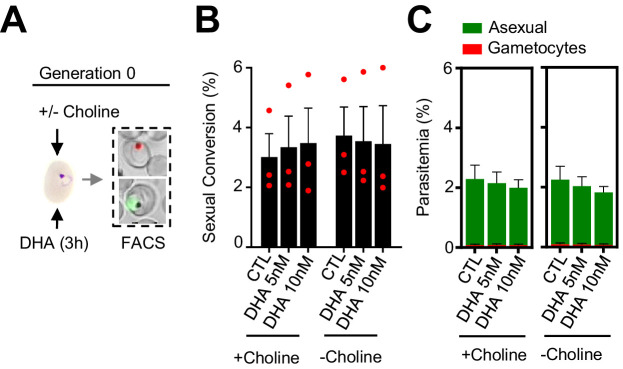
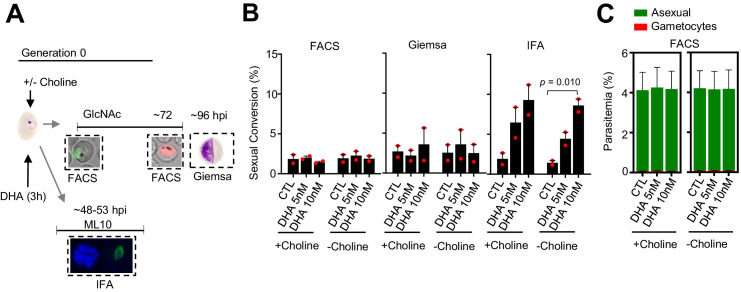
Figure 4. Effect of a dihydroartemisinin (DHA) pulse at the ring stage on sexual conversion by the same cycle conversion (SCC) route.
(A) Schematic representation of the assay. Tightly synchronized cultures of the NF54-gexp02-Tom line under non-inducing (+ choline) or inducing (– choline) conditions were exposed to a 3 hr DHA pulse at subcurative doses at the early ring stage (0–10 hpi). Sexual conversion was measured by flow cytometry (FACS) within the same multiplication cycle (~30–40 hpi) to determine the effect of the drug pulse only on production of new gametocytes by the SSC route. (B) Sexual conversion rate determined by flow cytometry. No significant difference (p<0.05) with the control (no drug) was observed for any treatment condition. (C) Distribution of absolute parasitemia of asexual and sexual parasites (from the same flow cytometry measurements as in panel B). In all panels, data are presented as the average and s.e.m. of three independent biological replicates.


