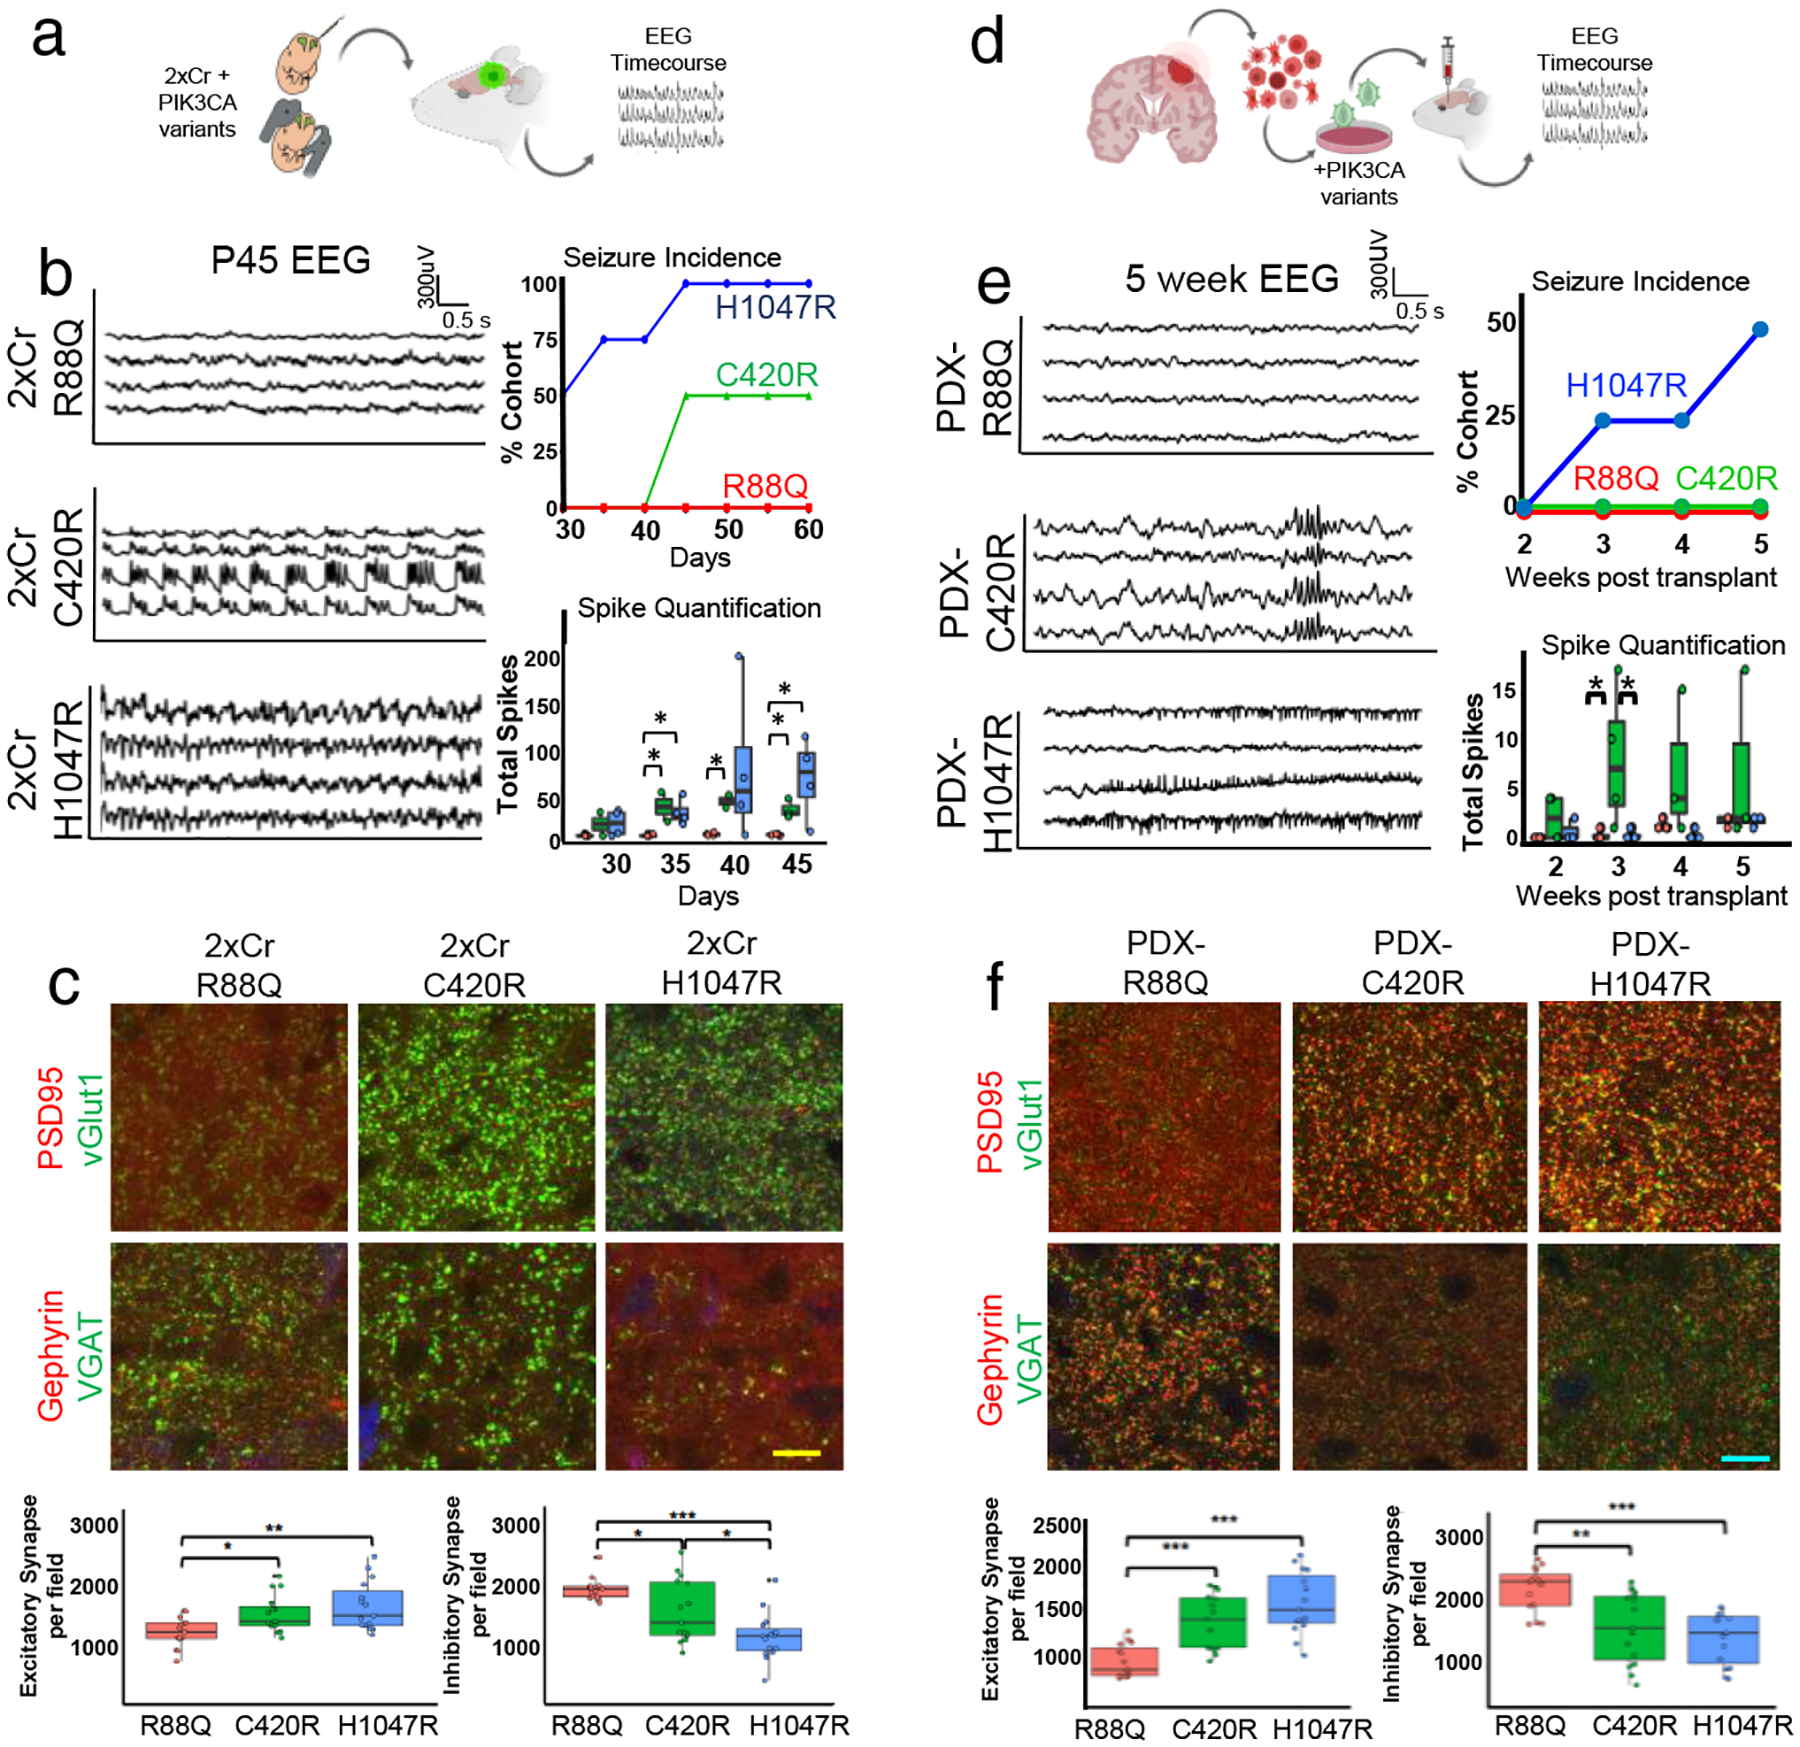
Figure 3. C420R- and H1047R-tumors promote hyperexcitability and synaptic imbalance across tumor models.

a) Schematic of experimental plan for IUE model. b) EEG traces of select variant tumor mice at P45 and quantification of EEG analyses. Traces for C420R and H1047R occurred during seizures. Seizure incidence and total spike activity quantifications; N = 4 mice per variant. Plots are centered on mean, boxing the interquartile range (25th-75th percentiles), with whiskers extending to 1.5 times the interquartile range above and below. p-values: * p<.05; calculated by One-way ANOVA. c) Antibody staining of excitatory and inhibitory synapses in P30 mouse brains at peritumoral margins and quantification. GFP signal (blue, not labeled) denotes tumor. Yellow scale bar = 12.5μm. Quantifications from 34,000μm2 field. Nbiological = 3 mice; Ntechnical = 5 repeats. Plots centered on mean, boxing the interquartile range (25th-75th percentiles), with whiskers extending to 1.5 times the interquartile range above and below. p-values: * p<.05; ** p<.01; *** p<.001; calculated by One-way ANOVA. d) Schematic of PDX model experiments e) EEG traces of mice bearing PDX tumors expressing PIK3CA variants 5 weeks after transplantation and quantification. Trace for PDX-C420R mice demonstrates aberrant EEG patterns without associated seizures; trace for PDX-H1047R was during an electrographic, non-convulsive seizure. For quantifications, N = 4 mice per variant. Plots are centered on mean, boxing the interquartile range (25th-75th percentiles), with whiskers extending to 1.5 times the interquartile range above and below. p-values: * p<.05; calculated by One-way ANOVA. f) Antibody staining of excitatory and inhibitory synapses from peritumoral margins of PDX brains and quantification. Blue scale bars = 10μm. Quantifications from 34,000μm2 field. Nbiological = 3 mice; Ntechnical = 5 repeats. Plots are centered on mean, boxing the interquartile range (25th-75th percentiles), with whiskers extending to 1.5 times the interquartile range above and below. p-values: * p<.05; ** p<.01; *** p<.001; calculated by One-way ANOVA. Color legend denoting variant on bottom of figure.
