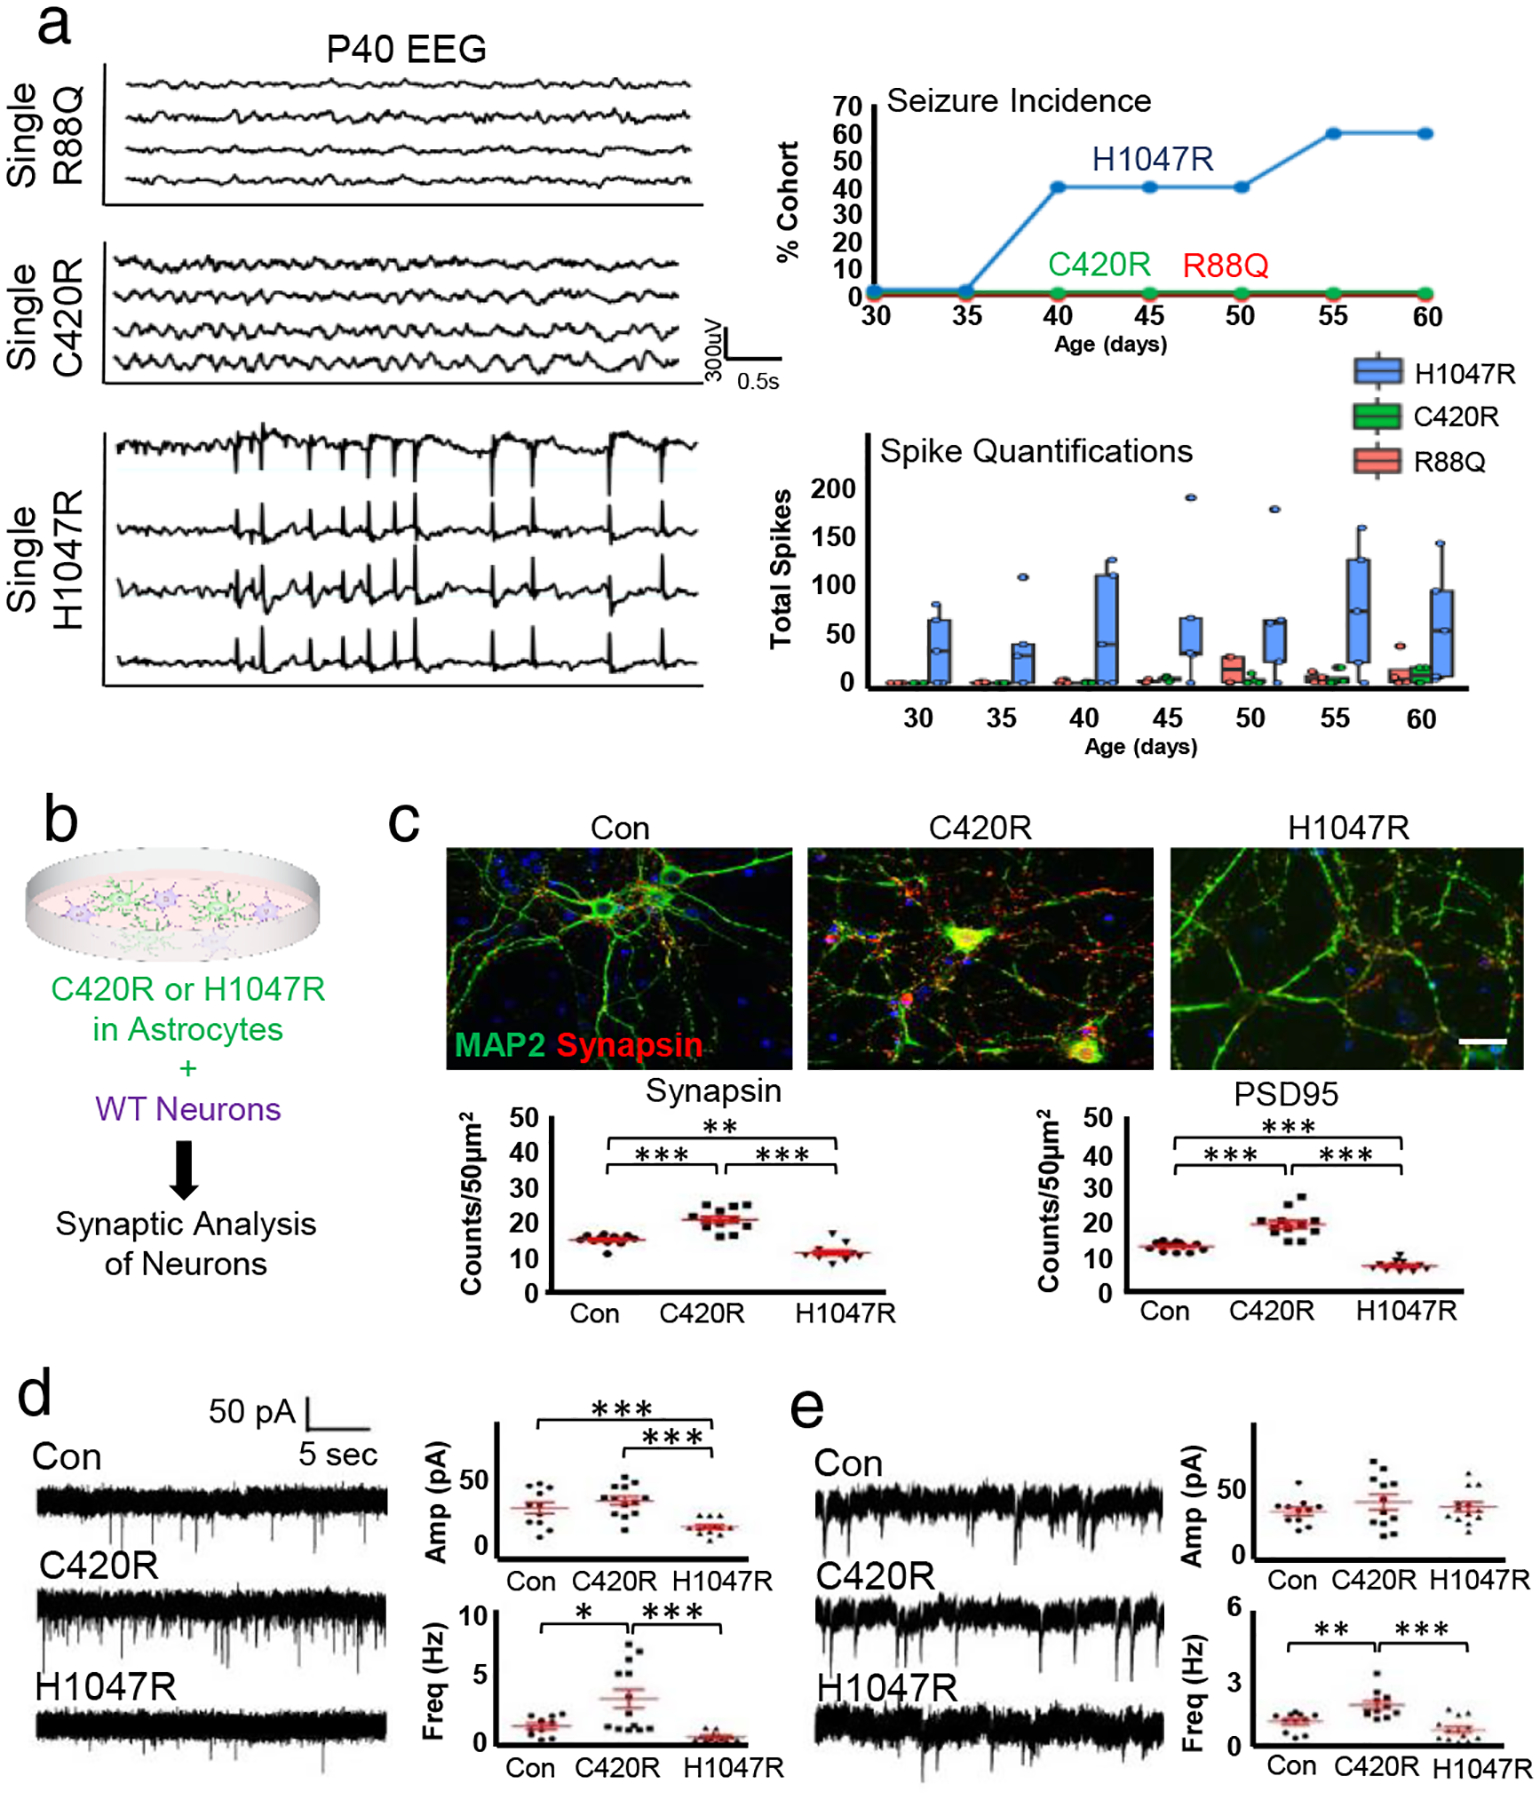
Figure 4. C420R and H1047R differentially promote synaptic imbalance.

a) EEG traces of variants overexpressed in mouse brains at P40 and quantification. Trace for H1047R was during seizure. Seizure incidence and total spike activity quantifications; N = 4 mice per variant. Plots centered on mean, boxing the interquartile range (25th-75th percentiles), with whiskers extending to 1.5 times the interquartile range above and below. No significant (<.05) p-values were calculated by One-way ANOVA. b) Astrocyte-neuron co-culture schematic. c) Antibody staining for Synapsin1 (red) and Map2 (green) of astrocyte-neuron co-cultures; astrocytes infected with control (Con), C420R, or H1047R viruses. Quantification of PSD95 and Synapsin1 staining. Ntechnical = 12 each condition. Plots are centered on mean, boxing the interquartile range (25th-75th percentiles), with whiskers extending to 1.5 times the interquartile range above and below. p-values: ** p<.01; *** p < .001; calculated by one-tail independent T-test; Tukey’s test was used to compare individual mean. White scale bar = 50μm. d) Representative traces of excitatory postsynaptic current from whole-cell recording of neurons co-cultured on astrocytes infected with control (Con), C420R, or H1047R viruses, with quantification. Ntechnical = 12 each condition. Plots are centered on mean, boxing the interquartile range (25th-75th percentiles), with whiskers extending to 1.5 times the interquartile range above and below. p-values: * p<.05; *** p < .001; calculated by one-tail independent T-test; Tukey’s test was used to compare individual mean. e) Analysis of inhibitory postsynaptic current. Ntechnical = 12 each condition. Plots are centered on mean, boxing the interquartile range (25th-75th percentiles), with whiskers extending to 1.5 times the interquartile range above and below. p-values: * p<.05; *** p < .001; calculated by one-tail independent T-test; Tukey’s test was used to compare individual mean.
