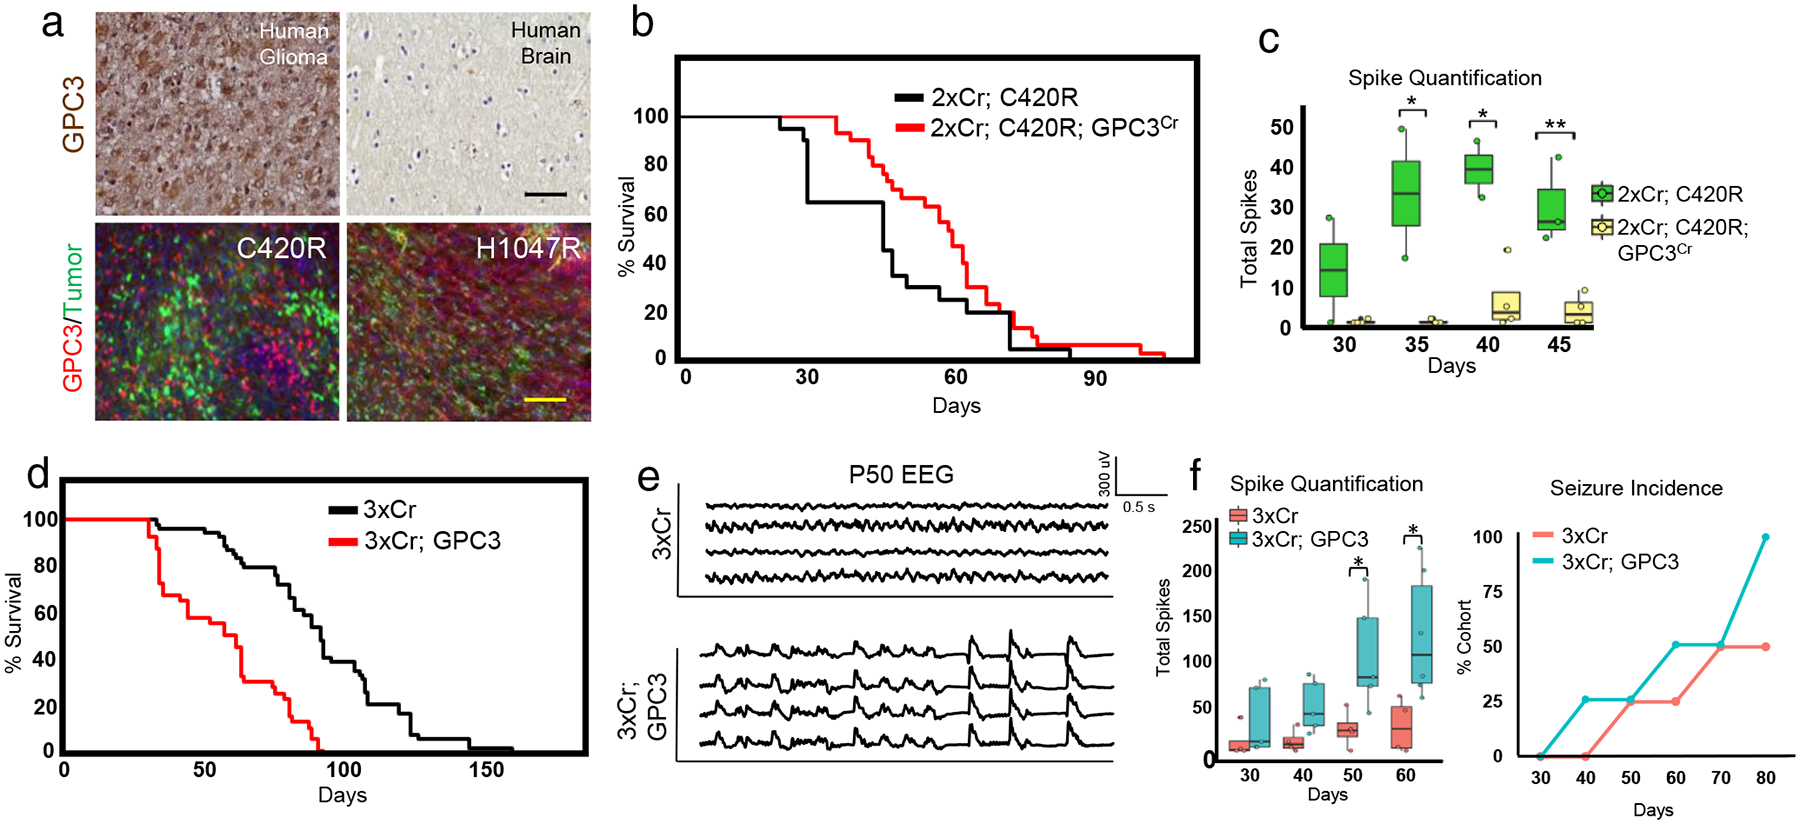
Figure 5. GPC3 promotes gliomagenesis and synaptic imbalance.

a) GPC3 staining of human GBM and normal human brain control. Black scale bar = 50μm. Human tissue staining was not independently repeated. GPC3 antibody staining of P30 mouse C420R and H1047R tumor brains. N = 4 mice for each variant. Yellow scale bar = 100μm. These experiments were independently repeated 4 times. b) Kaplan-Meier curve comparing GPC3Cr in 2xCr; C420R tumors. NC420R = 20; NC420R;GPC3CR = 30; statistics in Extended Data Fig. 8b. c) EEG spike activity decreases with GPC3Cr. Seizure incidence and total spike activity quantifications; N = 4 mice per variant. Plots are centered on mean, boxing the interquartile range (25th-75th percentiles), with whiskers extending to 1.5 times the interquartile range above and below. p-values: * p<.05; ** p<.01; calculated by One-way ANOVA. N = 4 mice each. d) Kaplan-Meier curve comparing GPC3 overexpression in 3xCr tumors. N3xCr = 55; N3xCr; GPC3 = 41; full statistics in Extended Data Fig 8b. e) EEG traces of GPC3 overexpression in 3xCr tumors at P50. f) Quantification of total spike activity and seizure incidence; N3xCr = 4 mice and N3xCr;GPC3 = 5 for spike quantifications. Plots are centered on mean, boxing the interquartile range (25th-75th percentiles), with whiskers extending to 1.5 times the interquartile range above and below. p-values: * p<.05; calculated by One-way ANOVA.; N = 4 mice per condition for seizure incidence.
