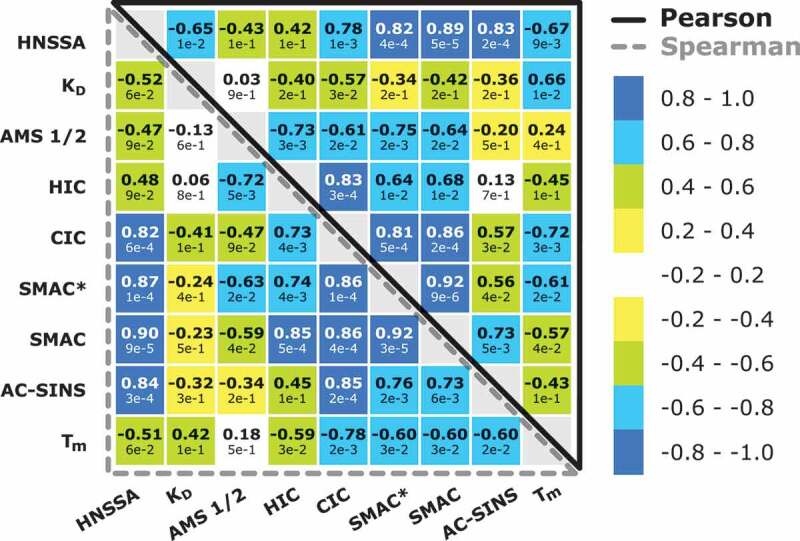
Figure 5.

Developabilixty score matrix showing the Pearson’s and Spearman’s correlation rank coefficient of the HNSSA and other developability assays. Bold numbers indicate the Pearson and Spearman rank-order correlation coefficients, while the values indicated below correspond to the respective p-values.
