FIGURE 1.

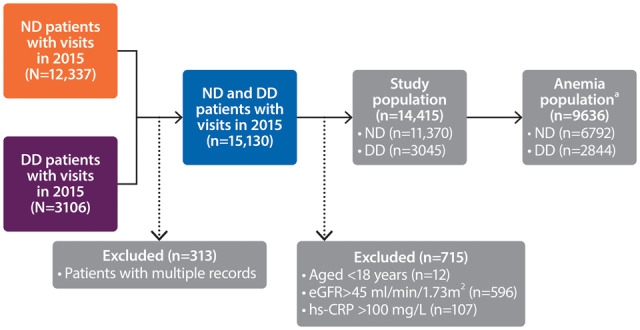
Flow chart of the study population. aIncluded patients with Hb levels <13 g/dL (males) or <12 g/dL (females) and those treated with ESAs.

Flow chart of the study population. aIncluded patients with Hb levels <13 g/dL (males) or <12 g/dL (females) and those treated with ESAs.