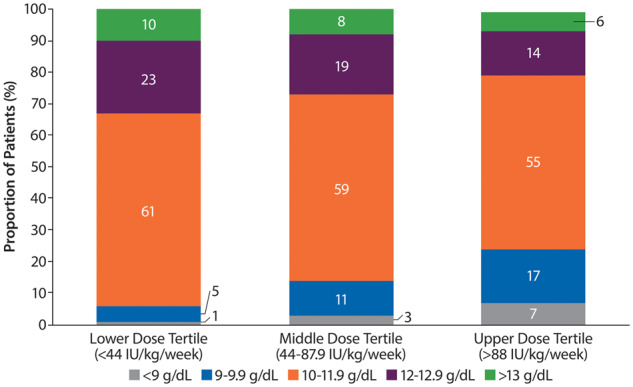
FIGURE 6.

Distribution of Hb levels in patients with body weight–adjusted ESA doses in the upper, middle and lower equivalent tertiles. Percentages may not add up to 100 due to rounding.

Distribution of Hb levels in patients with body weight–adjusted ESA doses in the upper, middle and lower equivalent tertiles. Percentages may not add up to 100 due to rounding.