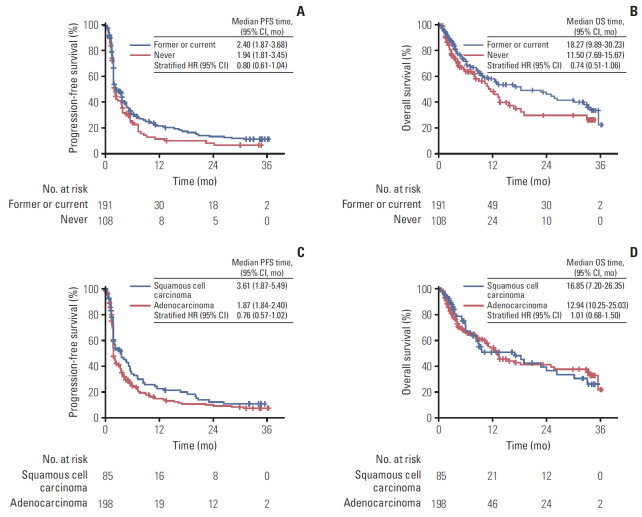
Fig. 3.
Kaplan-Meier curves. (A) Comparison of progression-free survival between former or current smokers versus never-smokers. (B) Comparison of overall survival between former or current smokers versus never-smokers. (C) Comparison of progression-free survival between squamous cell carcinoma and adenocarcinoma. (D) Comparison of overall survival between squamous cell carcinoma and adenocarcinoma. HR, hazard ratio; CI, confidence interval.

