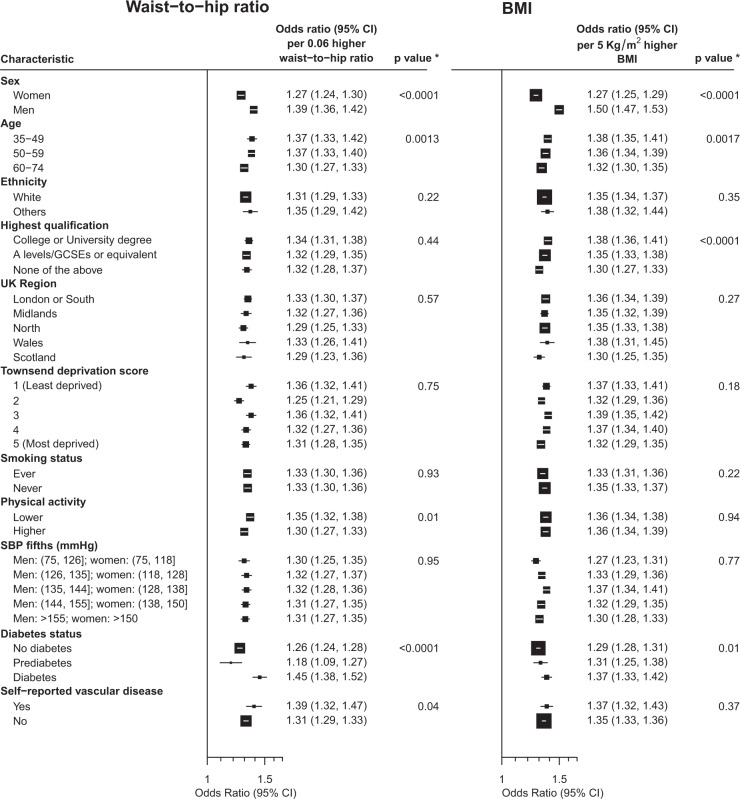
Fig. 3. Associations between incremental increase in adiposity (waist-to-hip ratio adjusted for BMI and BMI adjusted for waist-to-hip ratio) and a higher urinary albumin-to-creatinine ratio category by participant characteristics.
*p value for trend or heterogeneity test. BMI body mass index, SBP systolic blood pressure. Log ORs for a higher uACR category per incremental increase in adiposity by subgroups are the inverse variance weighted averages of the sex-specific log ORs by subgroups (calculated as the slopes of the inverse variance weighted regressions through the log ORs of the top four adiposity categories in each subgroup). Model was adjusted for confounders (age, ethnicity, education, region, Townsend deprivation index, smoking, physical activity where relevant) and reciprocal adiposity (i.e. waist-to-hip ratio adjusted for BMI, BMI adjusted for waist-to-hip ratio) at baseline.

