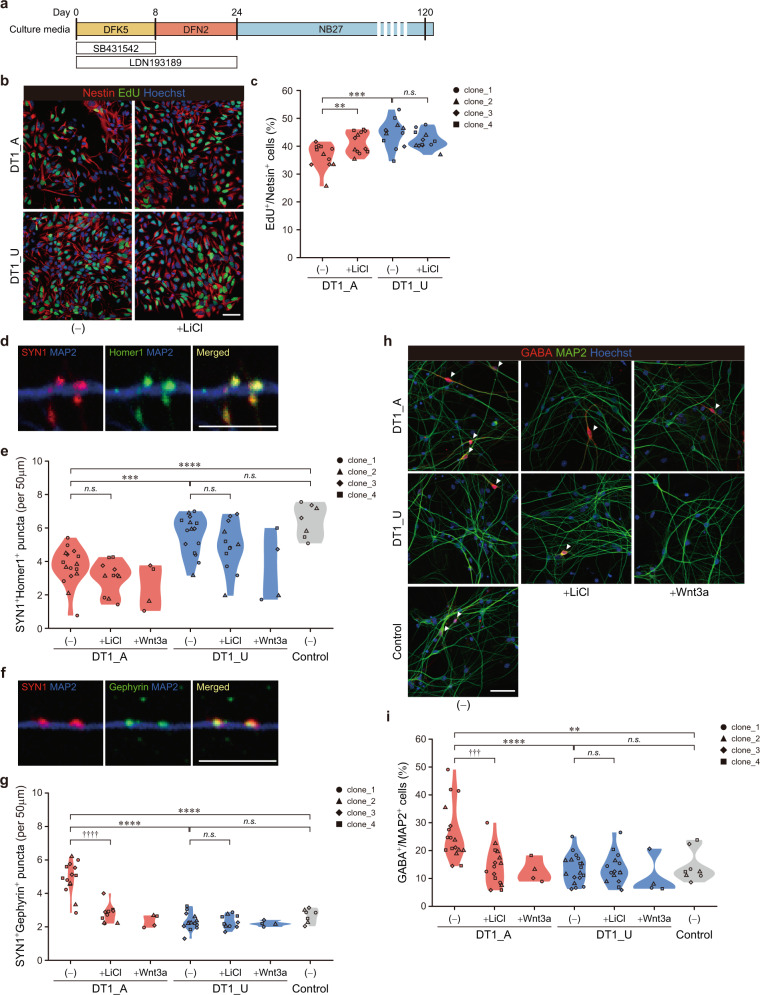
Fig. 3. Affected twin-derived neuronal cells exhibit reduced proliferation at the early stage of neurodevelopment and altered excitatory/inhibitory balance in differentiated neural networks at later stages.
a Schematic protocol for the differentiation of iPSCs into forebrain-specific neuronal cells. b Representative images of EdU and Nestin staining in 30-day-old NPCs. Scale bar, 50 μm. c Quantitative analysis of EdU-positive proliferating NPCs. Two-way ANOVA with post hoc t-test: **p < 0.01; ***p < 0.001; n.s. not significant. d Representative images of excitatory synapses expressing SYN1 and Homer1 on MAP2+ dendrite of 120-day-old neurons. Scale bar, 10 μm. e Quantification of SYN1+Homer1+ excitatory synapses. f Representative images of inhibitory synapses expressing SYN1 and Gephyrin on MAP2+ dendrite of 120-day-old neurons. Scale bar, 10 μm. g Quantification of SYN1+Gephyrin+ inhibitory synapses. h Sample images of immunostaining for GABA and MAP2 from 120-day-old neurons. Scale bar, 50 μm. Arrowheads indicate GABAergic neurons. i The proportion of GABA+MAP2+ cells. One-way ANOVA with Tukey’s multiple comparison test: **p < 0.01; ***p < 0.001; ****p < 0.0001; n.s. not significant; two-way ANOVA with post hoc t-test: †††p < 0.001; ††††p < 0.0001; n.s. not significant; Wnt3a-treated samples were not subjected to statistical analyses due to the limited sample size. See also Fig. S8.

