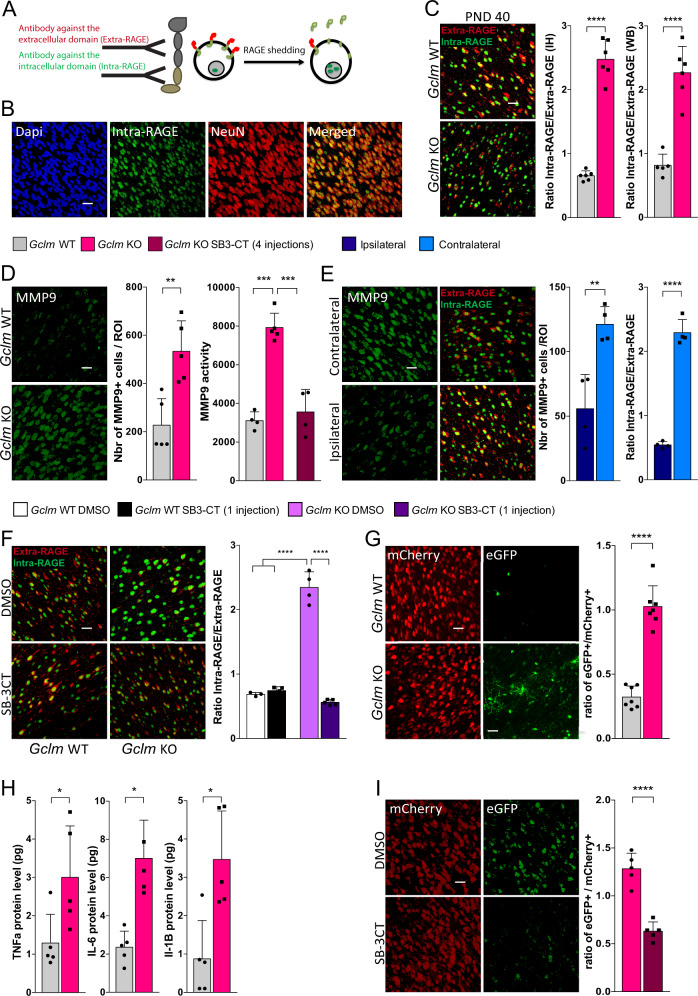
Fig. 2.
RAGE shedding, induced by MMP9, NFkB activation and pro-inflammatory cytokines are increased in the ACC of Gclm-KO mice as compared to WT mice at an early stage of development. a Schematic representation of the IH strategy for RAGE shedding visualization using two different antibodies. b Confocal images (Scale bar: 30 μm) showing RAGE intranuclear domain co-localization with NeuN, a neuronal marker. c RAGE shedding is higher in the ACC of Gclm-KO mice than in the ACC of WT mice at PND40. Confocal images (Scale bar: 30 μm) of RAGE shedding (expressed as a ratio of Intra-RAGE over Extra-RAGE) with the corresponding quantification graph for PND40. WB quantification of Intra-RAGE in the nucleus over Extra-RAGE at the membrane, using the fractioning method. d MMP9 protein/activity are higher in the ACC of Gclm-KO mice than in the ACC of WT mice at PND40. Confocal images (Scale bar: 30 μm) of the MMP9 protein level with corresponding quantification graph and a graph showing the MMP9 activity measured in the ACC by gelatin zymography in Gclm-WT and KO mice. SB-3CT (25 mg/kg) was injected 4 times, each injection separated by 4 days, from PND18 until PND30. e Inhibition of MMP9 by intracortical siRNA injection prevents RAGE shedding in the ACC of Gclm-KO mice. Gclm-KO mice were sacrificed 3 days after siRNA injection. Confocal images (Scale bar: 30 μm) showing MMP9 and RAGE shedding and the corresponding graphs showing the quantification at the site of injection (ipsilateral) and the contralateral, uninjected site. f Acute inhibition of MMP9 by peripheral injection of SB-3CT prevents RAGE shedding in the ACC of Gclm-KO. Confocal images (Scale bar: 30 μm) showing RAGE shedding in Gclm-KO and WT mice injected IP with SB-3CT (25 mg/kg) and sacrificed 2 h later. g NFkB activation is increased in the ACC of Gclm-KO compared to the levels in the ACC of WT mice at PND40. Gclm-KO and WT mice received intraventricular injection of AAV9-2YF-NRE-eGFP and AAV9-CBA-mCherry viral vectors at PND20 and were sacrificed at PND40. Confocal images (Scale bar: 30 μm) of the eGFP and mCherry signal and corresponding quantification of the eGFP+/mCherry+ cell ratio. (h) Pro-inflammatory cytokines are increased in the ACC of Gclm-KO compared to the levels in the ACC of WT mice at PND40. Quantification of the TNFα, IL-6, and IL-1β protein level by ELISA in the PFCx of Gclm-KO and WT mice. i NFkB activation is prevented by MMP9 inhibition with SB-3CT in the ACC of Gclm-KO mice at PND40. Confocal images (Scale bar: 30 μm) of the eGFP and mCherry signal and corresponding quantification of the eGFP+/mCherry+ cell ratio at PND40 after 4 injections of SB-3CT (25 mg/kg), each injection separated by 4 days, from PND18 until PND30. a–i Data are expressed as the mean ± s.e.d. (n = 4–8). ****P < 0.0001; ***P < 0.001, **P < 0.01; *P < 0.05; analyzed by Student’s t-test (a, d, e, g, h, i) or 2-way ANOVA followed by Tukey post hoc test (d, f)

