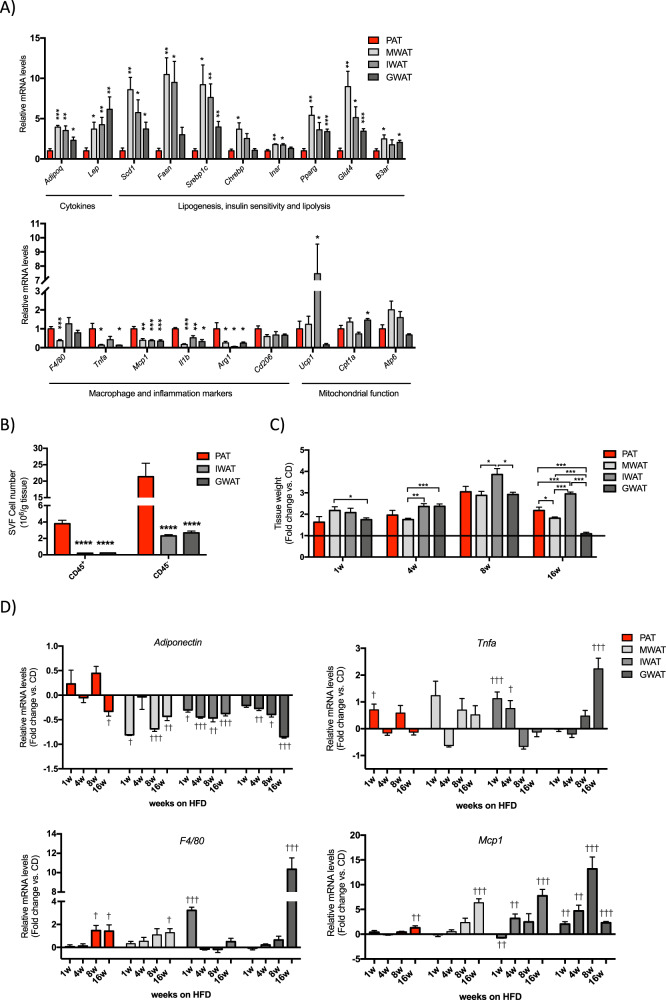
Fig. 2. Gene expression profile assessed by quantitative real-time PCR in PAT, MWAT, IWAT, and GWAT.
a Relative mRNA levels in PAT, MWAT, IWAT, and GWAT on chow-diet conditions (normalized to Actb). Data are expressed relative to the level in PAT. b FACS analysis of CD45+ (leukocytes) and CD45− cells in SVF isolated from PAT, IWAT, and GWAT. c Tissue weights of PAT, MWAT, IWAT, and GWAT in mice after 1-, 4-, 8- and 16-week HFD feeding, represented as fold-change from chow-diet-fed aged matched controls. d Relative mRNA levels in PAT, MWAT, IWAT, and GWAT in mice after 1-, 4-, 8- and 16-week HFD feeding (normalized to Actb and Tbp), represented as fold-change from chow diet. All values are expressed as mean ± SEM (n = 6 mice/group in 1, 4, and 8 weeks on HFD vs. CD; n = 10 mice/group in 16 weeks on HFD vs. CD). *p < 0.05, **p < 0.01, and ***p < 0.001 for PAT vs. other depots; †p < 0.05, ††p < 0.01, and †††p < 0.001 for mice-fed high-fat diet vs. chow diet. Adipoq adiponectin, Lep leptin, Scd1 stearoyl-coenzyme A desaturase 1, Fasn fatty acid synthase, Srebp1c sterol regulatory element-binding transcription factor-1c, Chrebp carbohydrate-responsive element-binding protein, Insr insulin receptor, Pparg peroxisome proliferator-activated receptor gamma, Glut4 glucose transporter type 4, B3ar adrenoceptor beta 3, Tnfa tumor necrosis factor alpha, Mcp1 monocyte chemoattractant protein-1, Il1b interleukin-1 beta, Arg1 arginase 1, Cd206 macrophage mannose receptor C-type 1, Ucp1 uncoupling protein-1, Cpt1b carnitine palmitoyltransferase 1b, Atp6 ATP synthase 6, PAT peripancreatic adipose tissue, MWAT mesenteric adipose tissue, IWAT inguinal adipose tissue, and GWAT gonadal adipose tissue.

