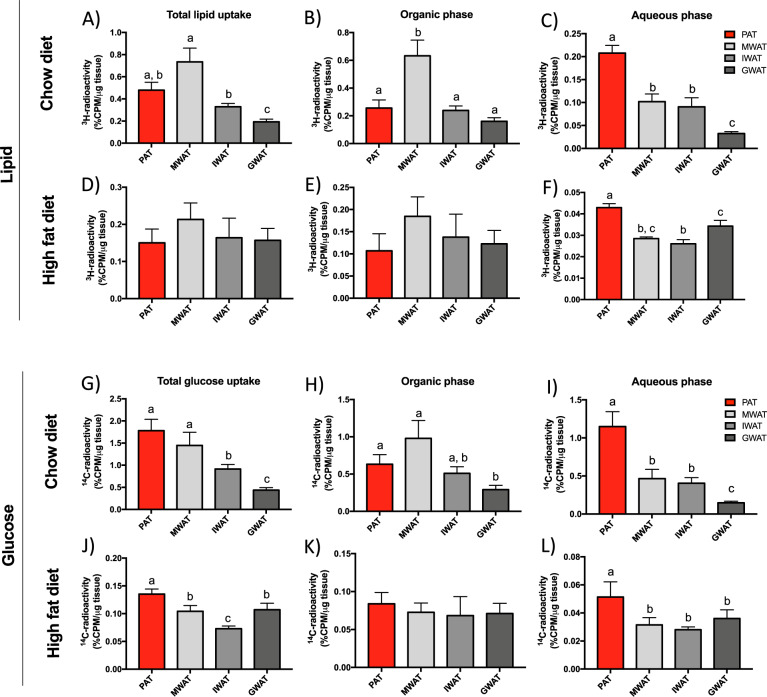
Fig. 3. Lipid and glucose metabolism in PAT, MWAT, IWAT, and GWAT in chow- and 16-week HFD-fed male mice.
a, d Total lipid uptake, b, e triglyceride accumulation (organic phase), and c, f lipid oxidation (aqueous phase) in different fat depots in respectively, chow (n = 8–11 mice/group) and 16-week HFD-fed mice (n = 5–6 mice/group). g, j Total glucose uptake, h, k de novo lipogenesis from glucose (organic phase), and i, l glucose catabolism (aqueous phase) in respectively, chow (n = 8 mice/group) and 16-week HFD-fed mice (n = 5–6 mice/group). All values are expressed as mean ± SEM. Values that do not share a common letter (a, b, and c) are statistically different. PAT peripancreatic adipose tissue, MWAT mesenteric adipose tissue, IWAT inguinal adipose tissue, and GWAT gonadal adipose tissue.

